Central American vs Immigrants from Hong Kong Disability Age 18 to 34
COMPARE
Central American
Immigrants from Hong Kong
Disability Age 18 to 34
Disability Age 18 to 34 Comparison
Central Americans
Immigrants from Hong Kong
6.2%
DISABILITY AGE 18 TO 34
97.5/ 100
METRIC RATING
95th/ 347
METRIC RANK
5.2%
DISABILITY AGE 18 TO 34
100.0/ 100
METRIC RATING
2nd/ 347
METRIC RANK
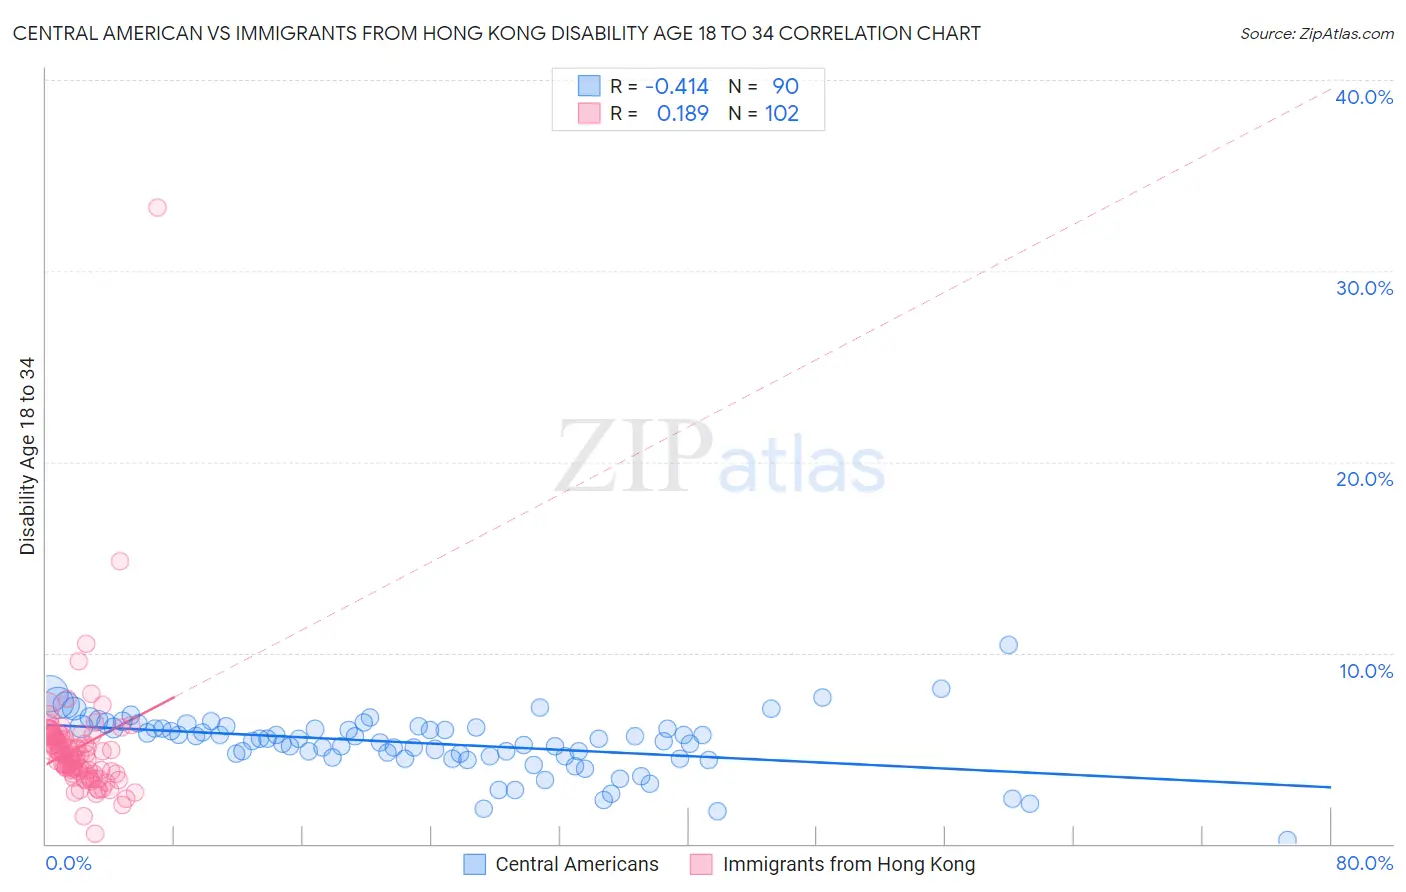
Central American vs Immigrants from Hong Kong Disability Age 18 to 34 Correlation Chart
The statistical analysis conducted on geographies consisting of 502,711,138 people shows a moderate negative correlation between the proportion of Central Americans and percentage of population with a disability between the ages 18 and 35 in the United States with a correlation coefficient (R) of -0.414 and weighted average of 6.2%. Similarly, the statistical analysis conducted on geographies consisting of 253,676,267 people shows a poor positive correlation between the proportion of Immigrants from Hong Kong and percentage of population with a disability between the ages 18 and 35 in the United States with a correlation coefficient (R) of 0.189 and weighted average of 5.2%, a difference of 18.5%.
Disability Age 18 to 34 Correlation Summary
| Measurement | Central American | Immigrants from Hong Kong |
| Minimum | 0.22% | 0.51% |
| Maximum | 10.4% | 33.3% |
| Range | 10.2% | 32.8% |
| Mean | 5.3% | 5.0% |
| Median | 5.5% | 4.7% |
| Interquartile 25% (IQ1) | 4.6% | 3.8% |
| Interquartile 75% (IQ3) | 6.1% | 5.6% |
| Interquartile Range (IQR) | 1.5% | 1.9% |
| Standard Deviation (Sample) | 1.5% | 3.4% |
| Standard Deviation (Population) | 1.5% | 3.3% |
Similar Demographics by Disability Age 18 to 34
Demographics Similar to Central Americans by Disability Age 18 to 34
In terms of disability age 18 to 34, the demographic groups most similar to Central Americans are Immigrants from Kazakhstan (6.2%, a difference of 0.030%), Immigrants from Uruguay (6.2%, a difference of 0.050%), Immigrants (6.2%, a difference of 0.080%), Jordanian (6.2%, a difference of 0.10%), and Uruguayan (6.2%, a difference of 0.13%).
| Demographics | Rating | Rank | Disability Age 18 to 34 |
| Cambodians | 97.8 /100 | #88 | Exceptional 6.2% |
| Turks | 97.8 /100 | #89 | Exceptional 6.2% |
| Immigrants | Vietnam | 97.7 /100 | #90 | Exceptional 6.2% |
| Immigrants | Philippines | 97.6 /100 | #91 | Exceptional 6.2% |
| Jordanians | 97.6 /100 | #92 | Exceptional 6.2% |
| Immigrants | Immigrants | 97.6 /100 | #93 | Exceptional 6.2% |
| Immigrants | Kazakhstan | 97.5 /100 | #94 | Exceptional 6.2% |
| Central Americans | 97.5 /100 | #95 | Exceptional 6.2% |
| Immigrants | Uruguay | 97.4 /100 | #96 | Exceptional 6.2% |
| Uruguayans | 97.3 /100 | #97 | Exceptional 6.2% |
| Immigrants | Syria | 97.2 /100 | #98 | Exceptional 6.2% |
| Immigrants | Ethiopia | 96.9 /100 | #99 | Exceptional 6.2% |
| Immigrants | Albania | 96.7 /100 | #100 | Exceptional 6.2% |
| Immigrants | Jamaica | 96.4 /100 | #101 | Exceptional 6.2% |
| Laotians | 96.4 /100 | #102 | Exceptional 6.2% |
Demographics Similar to Immigrants from Hong Kong by Disability Age 18 to 34
In terms of disability age 18 to 34, the demographic groups most similar to Immigrants from Hong Kong are Immigrants from Grenada (5.3%, a difference of 2.2%), Immigrants from Cuba (5.4%, a difference of 2.8%), Immigrants from Taiwan (5.4%, a difference of 3.1%), Immigrants from Armenia (5.0%, a difference of 4.3%), and Filipino (5.4%, a difference of 4.4%).
| Demographics | Rating | Rank | Disability Age 18 to 34 |
| Immigrants | Armenia | 100.0 /100 | #1 | Exceptional 5.0% |
| Immigrants | Hong Kong | 100.0 /100 | #2 | Exceptional 5.2% |
| Immigrants | Grenada | 100.0 /100 | #3 | Exceptional 5.3% |
| Immigrants | Cuba | 100.0 /100 | #4 | Exceptional 5.4% |
| Immigrants | Taiwan | 100.0 /100 | #5 | Exceptional 5.4% |
| Filipinos | 100.0 /100 | #6 | Exceptional 5.4% |
| Immigrants | China | 100.0 /100 | #7 | Exceptional 5.4% |
| Immigrants | Guyana | 100.0 /100 | #8 | Exceptional 5.5% |
| Guyanese | 100.0 /100 | #9 | Exceptional 5.5% |
| Immigrants | Uzbekistan | 100.0 /100 | #10 | Exceptional 5.5% |
| Vietnamese | 100.0 /100 | #11 | Exceptional 5.5% |
| Immigrants | St. Vincent and the Grenadines | 100.0 /100 | #12 | Exceptional 5.5% |
| Immigrants | Iran | 100.0 /100 | #13 | Exceptional 5.5% |
| Indians (Asian) | 100.0 /100 | #14 | Exceptional 5.5% |
| Immigrants | India | 100.0 /100 | #15 | Exceptional 5.6% |