Central American vs Barbadian Disability Age 18 to 34
COMPARE
Central American
Barbadian
Disability Age 18 to 34
Disability Age 18 to 34 Comparison
Central Americans
Barbadians
6.2%
DISABILITY AGE 18 TO 34
97.5/ 100
METRIC RATING
95th/ 347
METRIC RANK
6.1%
DISABILITY AGE 18 TO 34
98.3/ 100
METRIC RATING
83rd/ 347
METRIC RANK
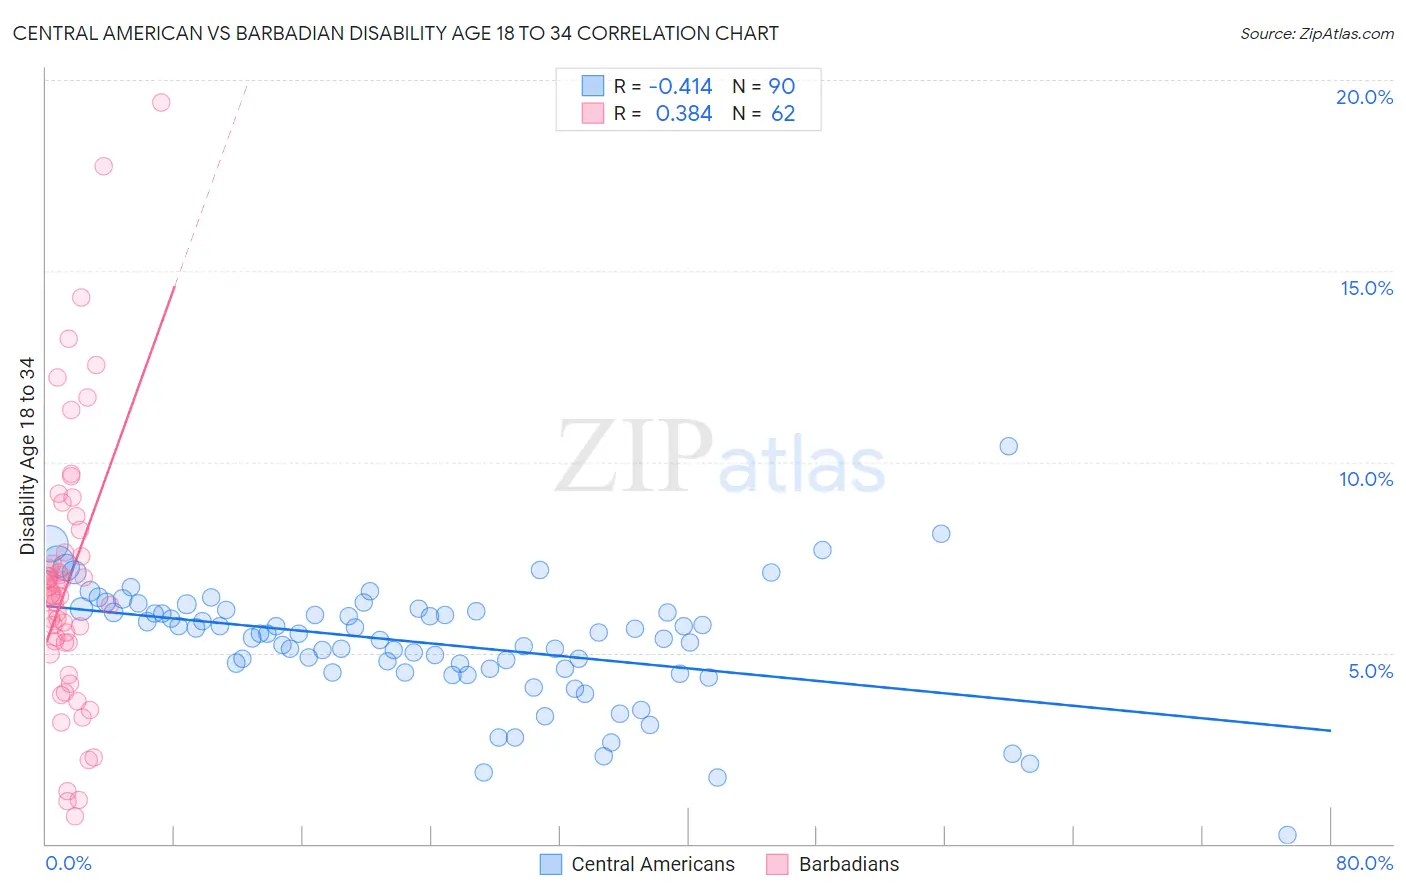
Central American vs Barbadian Disability Age 18 to 34 Correlation Chart
The statistical analysis conducted on geographies consisting of 502,711,138 people shows a moderate negative correlation between the proportion of Central Americans and percentage of population with a disability between the ages 18 and 35 in the United States with a correlation coefficient (R) of -0.414 and weighted average of 6.2%. Similarly, the statistical analysis conducted on geographies consisting of 141,268,708 people shows a mild positive correlation between the proportion of Barbadians and percentage of population with a disability between the ages 18 and 35 in the United States with a correlation coefficient (R) of 0.384 and weighted average of 6.1%, a difference of 0.77%.
Disability Age 18 to 34 Correlation Summary
| Measurement | Central American | Barbadian |
| Minimum | 0.22% | 0.73% |
| Maximum | 10.4% | 19.4% |
| Range | 10.2% | 18.7% |
| Mean | 5.3% | 6.9% |
| Median | 5.5% | 6.5% |
| Interquartile 25% (IQ1) | 4.6% | 5.3% |
| Interquartile 75% (IQ3) | 6.1% | 7.6% |
| Interquartile Range (IQR) | 1.5% | 2.4% |
| Standard Deviation (Sample) | 1.5% | 3.6% |
| Standard Deviation (Population) | 1.5% | 3.6% |
Demographics Similar to Central Americans and Barbadians by Disability Age 18 to 34
In terms of disability age 18 to 34, the demographic groups most similar to Central Americans are Immigrants from Kazakhstan (6.2%, a difference of 0.030%), Immigrants from Uruguay (6.2%, a difference of 0.050%), Immigrants (6.2%, a difference of 0.080%), Jordanian (6.2%, a difference of 0.10%), and Uruguayan (6.2%, a difference of 0.13%). Similarly, the demographic groups most similar to Barbadians are Israeli (6.1%, a difference of 0.030%), Immigrants from Northern Africa (6.1%, a difference of 0.060%), Immigrants from Ireland (6.1%, a difference of 0.11%), Immigrants from Australia (6.1%, a difference of 0.25%), and Immigrants from Chile (6.1%, a difference of 0.29%).
| Demographics | Rating | Rank | Disability Age 18 to 34 |
| Afghans | 98.7 /100 | #79 | Exceptional 6.1% |
| Immigrants | Chile | 98.5 /100 | #80 | Exceptional 6.1% |
| Immigrants | Australia | 98.5 /100 | #81 | Exceptional 6.1% |
| Immigrants | Northern Africa | 98.4 /100 | #82 | Exceptional 6.1% |
| Barbadians | 98.3 /100 | #83 | Exceptional 6.1% |
| Israelis | 98.3 /100 | #84 | Exceptional 6.1% |
| Immigrants | Ireland | 98.2 /100 | #85 | Exceptional 6.1% |
| Immigrants | Kuwait | 98.0 /100 | #86 | Exceptional 6.2% |
| Immigrants | Eastern Europe | 97.9 /100 | #87 | Exceptional 6.2% |
| Cambodians | 97.8 /100 | #88 | Exceptional 6.2% |
| Turks | 97.8 /100 | #89 | Exceptional 6.2% |
| Immigrants | Vietnam | 97.7 /100 | #90 | Exceptional 6.2% |
| Immigrants | Philippines | 97.6 /100 | #91 | Exceptional 6.2% |
| Jordanians | 97.6 /100 | #92 | Exceptional 6.2% |
| Immigrants | Immigrants | 97.6 /100 | #93 | Exceptional 6.2% |
| Immigrants | Kazakhstan | 97.5 /100 | #94 | Exceptional 6.2% |
| Central Americans | 97.5 /100 | #95 | Exceptional 6.2% |
| Immigrants | Uruguay | 97.4 /100 | #96 | Exceptional 6.2% |
| Uruguayans | 97.3 /100 | #97 | Exceptional 6.2% |
| Immigrants | Syria | 97.2 /100 | #98 | Exceptional 6.2% |
| Immigrants | Ethiopia | 96.9 /100 | #99 | Exceptional 6.2% |