Burmese vs Barbadian Disability Age 18 to 34
COMPARE
Burmese
Barbadian
Disability Age 18 to 34
Disability Age 18 to 34 Comparison
Burmese
Barbadians
6.0%
DISABILITY AGE 18 TO 34
99.5/ 100
METRIC RATING
66th/ 347
METRIC RANK
6.1%
DISABILITY AGE 18 TO 34
98.3/ 100
METRIC RATING
83rd/ 347
METRIC RANK
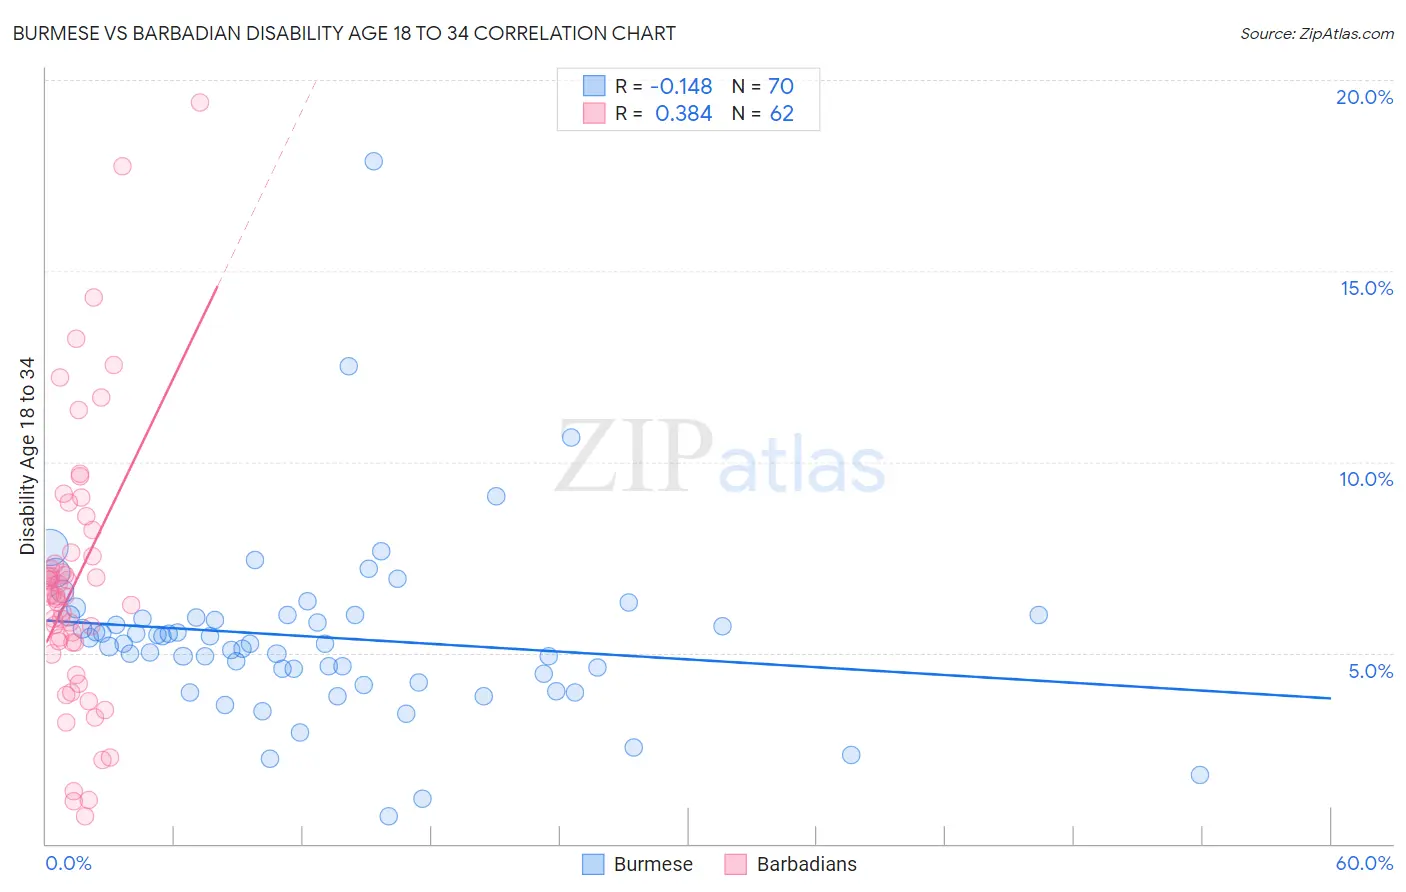
Burmese vs Barbadian Disability Age 18 to 34 Correlation Chart
The statistical analysis conducted on geographies consisting of 464,073,050 people shows a poor negative correlation between the proportion of Burmese and percentage of population with a disability between the ages 18 and 35 in the United States with a correlation coefficient (R) of -0.148 and weighted average of 6.0%. Similarly, the statistical analysis conducted on geographies consisting of 141,268,708 people shows a mild positive correlation between the proportion of Barbadians and percentage of population with a disability between the ages 18 and 35 in the United States with a correlation coefficient (R) of 0.384 and weighted average of 6.1%, a difference of 2.4%.
Disability Age 18 to 34 Correlation Summary
| Measurement | Burmese | Barbadian |
| Minimum | 0.73% | 0.73% |
| Maximum | 17.9% | 19.4% |
| Range | 17.1% | 18.7% |
| Mean | 5.4% | 6.9% |
| Median | 5.3% | 6.5% |
| Interquartile 25% (IQ1) | 4.5% | 5.3% |
| Interquartile 75% (IQ3) | 6.0% | 7.6% |
| Interquartile Range (IQR) | 1.5% | 2.4% |
| Standard Deviation (Sample) | 2.4% | 3.6% |
| Standard Deviation (Population) | 2.4% | 3.6% |
Demographics Similar to Burmese and Barbadians by Disability Age 18 to 34
In terms of disability age 18 to 34, the demographic groups most similar to Burmese are Immigrants from North Macedonia (6.0%, a difference of 0.040%), Immigrants from Poland (6.0%, a difference of 0.10%), Trinidadian and Tobagonian (6.0%, a difference of 0.14%), Taiwanese (6.0%, a difference of 0.28%), and Immigrants from West Indies (6.0%, a difference of 0.35%). Similarly, the demographic groups most similar to Barbadians are Israeli (6.1%, a difference of 0.030%), Immigrants from Northern Africa (6.1%, a difference of 0.060%), Immigrants from Australia (6.1%, a difference of 0.25%), Immigrants from Chile (6.1%, a difference of 0.29%), and Afghan (6.1%, a difference of 0.48%).
| Demographics | Rating | Rank | Disability Age 18 to 34 |
| Taiwanese | 99.6 /100 | #64 | Exceptional 6.0% |
| Trinidadians and Tobagonians | 99.5 /100 | #65 | Exceptional 6.0% |
| Burmese | 99.5 /100 | #66 | Exceptional 6.0% |
| Immigrants | North Macedonia | 99.5 /100 | #67 | Exceptional 6.0% |
| Immigrants | Poland | 99.5 /100 | #68 | Exceptional 6.0% |
| Immigrants | West Indies | 99.4 /100 | #69 | Exceptional 6.0% |
| Immigrants | Greece | 99.4 /100 | #70 | Exceptional 6.0% |
| Immigrants | Japan | 99.3 /100 | #71 | Exceptional 6.0% |
| Immigrants | Lebanon | 99.2 /100 | #72 | Exceptional 6.0% |
| Cypriots | 99.2 /100 | #73 | Exceptional 6.0% |
| Haitians | 99.2 /100 | #74 | Exceptional 6.0% |
| Immigrants | Turkey | 99.1 /100 | #75 | Exceptional 6.1% |
| Immigrants | Western Asia | 98.9 /100 | #76 | Exceptional 6.1% |
| Immigrants | Russia | 98.9 /100 | #77 | Exceptional 6.1% |
| Assyrians/Chaldeans/Syriacs | 98.9 /100 | #78 | Exceptional 6.1% |
| Afghans | 98.7 /100 | #79 | Exceptional 6.1% |
| Immigrants | Chile | 98.5 /100 | #80 | Exceptional 6.1% |
| Immigrants | Australia | 98.5 /100 | #81 | Exceptional 6.1% |
| Immigrants | Northern Africa | 98.4 /100 | #82 | Exceptional 6.1% |
| Barbadians | 98.3 /100 | #83 | Exceptional 6.1% |
| Israelis | 98.3 /100 | #84 | Exceptional 6.1% |