Central American vs Barbadian No Schooling Completed
COMPARE
Central American
Barbadian
No Schooling Completed
No Schooling Completed Comparison
Central Americans
Barbadians
3.4%
NO SCHOOLING COMPLETED
0.0/ 100
METRIC RATING
332nd/ 347
METRIC RANK
2.6%
NO SCHOOLING COMPLETED
0.1/ 100
METRIC RATING
279th/ 347
METRIC RANK
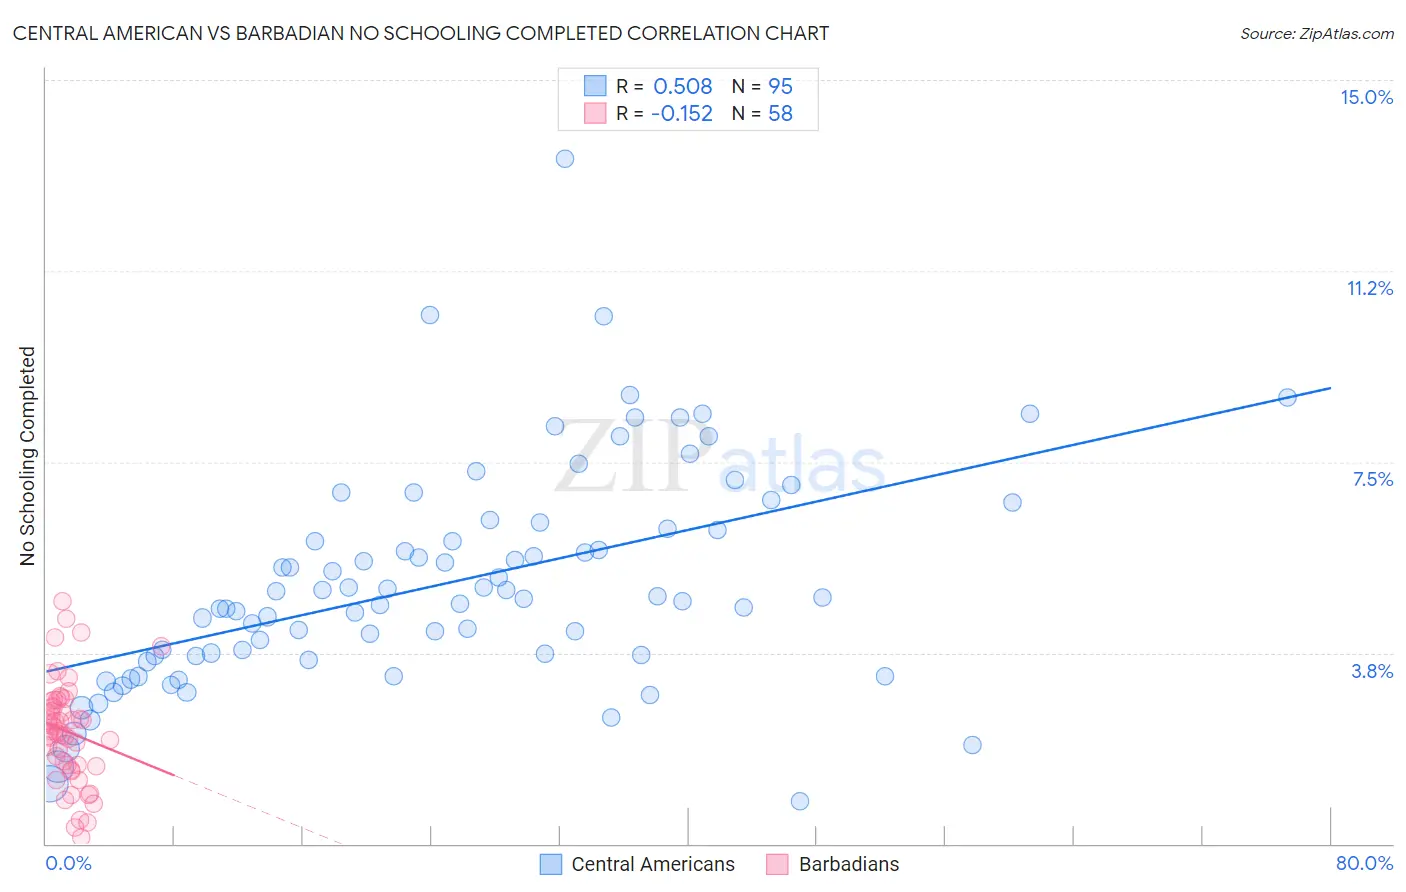
Central American vs Barbadian No Schooling Completed Correlation Chart
The statistical analysis conducted on geographies consisting of 497,423,122 people shows a substantial positive correlation between the proportion of Central Americans and percentage of population with no schooling in the United States with a correlation coefficient (R) of 0.508 and weighted average of 3.4%. Similarly, the statistical analysis conducted on geographies consisting of 140,997,327 people shows a poor negative correlation between the proportion of Barbadians and percentage of population with no schooling in the United States with a correlation coefficient (R) of -0.152 and weighted average of 2.6%, a difference of 30.8%.
No Schooling Completed Correlation Summary
| Measurement | Central American | Barbadian |
| Minimum | 0.83% | 0.12% |
| Maximum | 13.5% | 4.8% |
| Range | 12.6% | 4.6% |
| Mean | 5.1% | 2.2% |
| Median | 4.8% | 2.2% |
| Interquartile 25% (IQ1) | 3.7% | 1.6% |
| Interquartile 75% (IQ3) | 6.2% | 2.8% |
| Interquartile Range (IQR) | 2.5% | 1.2% |
| Standard Deviation (Sample) | 2.2% | 1.0% |
| Standard Deviation (Population) | 2.1% | 0.99% |
Similar Demographics by No Schooling Completed
Demographics Similar to Central Americans by No Schooling Completed
In terms of no schooling completed, the demographic groups most similar to Central Americans are Immigrants from Dominican Republic (3.4%, a difference of 0.060%), Japanese (3.3%, a difference of 1.5%), Immigrants from Armenia (3.3%, a difference of 1.5%), Guatemalan (3.5%, a difference of 1.8%), and Immigrants from Vietnam (3.3%, a difference of 2.0%).
| Demographics | Rating | Rank | No Schooling Completed |
| Dominicans | 0.0 /100 | #325 | Tragic 3.2% |
| Indonesians | 0.0 /100 | #326 | Tragic 3.2% |
| Immigrants | Latin America | 0.0 /100 | #327 | Tragic 3.3% |
| Mexicans | 0.0 /100 | #328 | Tragic 3.3% |
| Immigrants | Vietnam | 0.0 /100 | #329 | Tragic 3.3% |
| Immigrants | Armenia | 0.0 /100 | #330 | Tragic 3.3% |
| Japanese | 0.0 /100 | #331 | Tragic 3.3% |
| Central Americans | 0.0 /100 | #332 | Tragic 3.4% |
| Immigrants | Dominican Republic | 0.0 /100 | #333 | Tragic 3.4% |
| Guatemalans | 0.0 /100 | #334 | Tragic 3.5% |
| Immigrants | Cambodia | 0.0 /100 | #335 | Tragic 3.5% |
| Immigrants | Fiji | 0.0 /100 | #336 | Tragic 3.5% |
| Immigrants | Cabo Verde | 0.0 /100 | #337 | Tragic 3.5% |
| Bangladeshis | 0.0 /100 | #338 | Tragic 3.5% |
| Yakama | 0.0 /100 | #339 | Tragic 3.6% |
Demographics Similar to Barbadians by No Schooling Completed
In terms of no schooling completed, the demographic groups most similar to Barbadians are Trinidadian and Tobagonian (2.6%, a difference of 0.020%), Afghan (2.6%, a difference of 0.10%), Immigrants from Ghana (2.6%, a difference of 0.30%), Immigrants from Uzbekistan (2.6%, a difference of 0.55%), and Immigrants from Philippines (2.6%, a difference of 0.74%).
| Demographics | Rating | Rank | No Schooling Completed |
| Immigrants | Bolivia | 0.2 /100 | #272 | Tragic 2.5% |
| Immigrants | Cameroon | 0.1 /100 | #273 | Tragic 2.5% |
| Ghanaians | 0.1 /100 | #274 | Tragic 2.6% |
| Immigrants | China | 0.1 /100 | #275 | Tragic 2.6% |
| Immigrants | Western Africa | 0.1 /100 | #276 | Tragic 2.6% |
| Immigrants | Philippines | 0.1 /100 | #277 | Tragic 2.6% |
| Immigrants | Uzbekistan | 0.1 /100 | #278 | Tragic 2.6% |
| Barbadians | 0.1 /100 | #279 | Tragic 2.6% |
| Trinidadians and Tobagonians | 0.1 /100 | #280 | Tragic 2.6% |
| Afghans | 0.1 /100 | #281 | Tragic 2.6% |
| Immigrants | Ghana | 0.1 /100 | #282 | Tragic 2.6% |
| Immigrants | Trinidad and Tobago | 0.0 /100 | #283 | Tragic 2.6% |
| Immigrants | West Indies | 0.0 /100 | #284 | Tragic 2.7% |
| Immigrants | Barbados | 0.0 /100 | #285 | Tragic 2.7% |
| Immigrants | Portugal | 0.0 /100 | #286 | Tragic 2.7% |