Immigrants from Austria vs Hawaiian Disability Age 35 to 64
COMPARE
Immigrants from Austria
Hawaiian
Disability Age 35 to 64
Disability Age 35 to 64 Comparison
Immigrants from Austria
Hawaiians
10.4%
DISABILITY AGE 35 TO 64
97.8/ 100
METRIC RATING
104th/ 347
METRIC RANK
12.3%
DISABILITY AGE 35 TO 64
0.9/ 100
METRIC RATING
254th/ 347
METRIC RANK
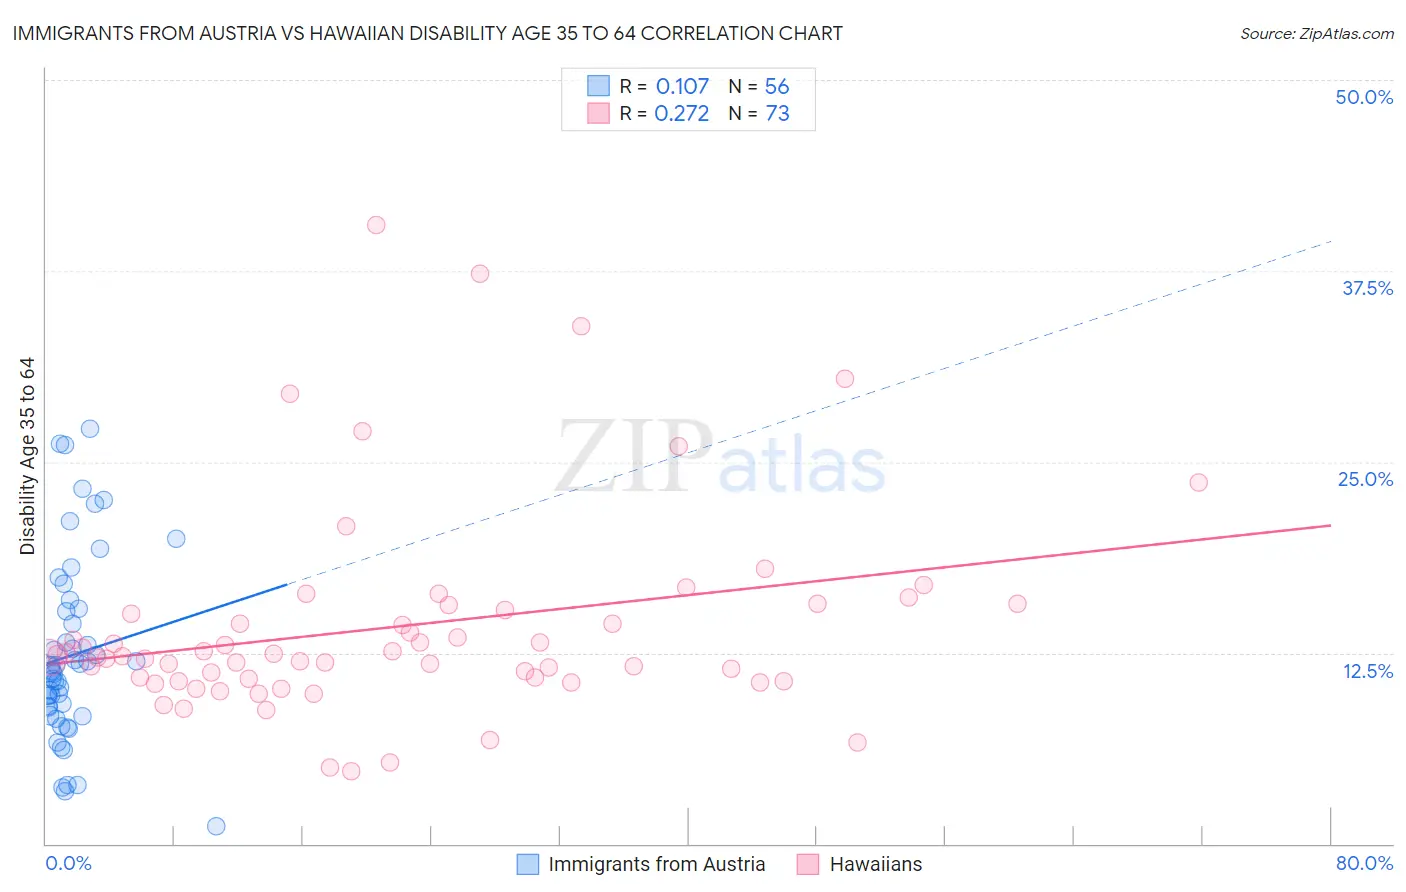
Immigrants from Austria vs Hawaiian Disability Age 35 to 64 Correlation Chart
The statistical analysis conducted on geographies consisting of 167,953,043 people shows a poor positive correlation between the proportion of Immigrants from Austria and percentage of population with a disability between the ages 34 and 64 in the United States with a correlation coefficient (R) of 0.107 and weighted average of 10.4%. Similarly, the statistical analysis conducted on geographies consisting of 327,340,087 people shows a weak positive correlation between the proportion of Hawaiians and percentage of population with a disability between the ages 34 and 64 in the United States with a correlation coefficient (R) of 0.272 and weighted average of 12.3%, a difference of 18.4%.
Disability Age 35 to 64 Correlation Summary
| Measurement | Immigrants from Austria | Hawaiian |
| Minimum | 1.1% | 4.7% |
| Maximum | 27.1% | 40.5% |
| Range | 26.0% | 35.8% |
| Mean | 12.3% | 14.2% |
| Median | 11.4% | 12.3% |
| Interquartile 25% (IQ1) | 8.7% | 10.7% |
| Interquartile 75% (IQ3) | 15.3% | 15.5% |
| Interquartile Range (IQR) | 6.6% | 4.7% |
| Standard Deviation (Sample) | 6.0% | 6.8% |
| Standard Deviation (Population) | 5.9% | 6.8% |
Similar Demographics by Disability Age 35 to 64
Demographics Similar to Immigrants from Austria by Disability Age 35 to 64
In terms of disability age 35 to 64, the demographic groups most similar to Immigrants from Austria are Macedonian (10.4%, a difference of 0.020%), Immigrants from Ukraine (10.4%, a difference of 0.14%), Immigrants from Western Asia (10.4%, a difference of 0.17%), Immigrants from Hungary (10.4%, a difference of 0.17%), and Immigrants from Philippines (10.4%, a difference of 0.23%).
| Demographics | Rating | Rank | Disability Age 35 to 64 |
| Immigrants | Denmark | 98.4 /100 | #97 | Exceptional 10.3% |
| Immigrants | Uruguay | 98.3 /100 | #98 | Exceptional 10.3% |
| Palestinians | 98.2 /100 | #99 | Exceptional 10.4% |
| Immigrants | Jordan | 98.1 /100 | #100 | Exceptional 10.4% |
| Immigrants | Philippines | 98.0 /100 | #101 | Exceptional 10.4% |
| Immigrants | Western Asia | 98.0 /100 | #102 | Exceptional 10.4% |
| Immigrants | Ukraine | 97.9 /100 | #103 | Exceptional 10.4% |
| Immigrants | Austria | 97.8 /100 | #104 | Exceptional 10.4% |
| Macedonians | 97.8 /100 | #105 | Exceptional 10.4% |
| Immigrants | Hungary | 97.6 /100 | #106 | Exceptional 10.4% |
| Zimbabweans | 97.4 /100 | #107 | Exceptional 10.4% |
| Ethiopians | 97.4 /100 | #108 | Exceptional 10.5% |
| Immigrants | Ethiopia | 97.2 /100 | #109 | Exceptional 10.5% |
| Koreans | 97.1 /100 | #110 | Exceptional 10.5% |
| Brazilians | 96.9 /100 | #111 | Exceptional 10.5% |
Demographics Similar to Hawaiians by Disability Age 35 to 64
In terms of disability age 35 to 64, the demographic groups most similar to Hawaiians are Dutch (12.3%, a difference of 0.11%), Japanese (12.3%, a difference of 0.13%), Irish (12.3%, a difference of 0.14%), Scottish (12.4%, a difference of 0.30%), and German (12.3%, a difference of 0.40%).
| Demographics | Rating | Rank | Disability Age 35 to 64 |
| Immigrants | Senegal | 1.3 /100 | #247 | Tragic 12.2% |
| Spaniards | 1.3 /100 | #248 | Tragic 12.3% |
| Hispanics or Latinos | 1.3 /100 | #249 | Tragic 12.3% |
| Immigrants | Burma/Myanmar | 1.2 /100 | #250 | Tragic 12.3% |
| Germans | 1.1 /100 | #251 | Tragic 12.3% |
| Irish | 1.0 /100 | #252 | Tragic 12.3% |
| Dutch | 1.0 /100 | #253 | Tragic 12.3% |
| Hawaiians | 0.9 /100 | #254 | Tragic 12.3% |
| Japanese | 0.8 /100 | #255 | Tragic 12.3% |
| Scottish | 0.8 /100 | #256 | Tragic 12.4% |
| Mexicans | 0.7 /100 | #257 | Tragic 12.4% |
| Welsh | 0.6 /100 | #258 | Tragic 12.4% |
| English | 0.6 /100 | #259 | Tragic 12.4% |
| German Russians | 0.5 /100 | #260 | Tragic 12.5% |
| Malaysians | 0.5 /100 | #261 | Tragic 12.5% |