Burmese vs South American Indian Disability Age 35 to 64
COMPARE
Burmese
South American Indian
Disability Age 35 to 64
Disability Age 35 to 64 Comparison
Burmese
South American Indians
9.2%
DISABILITY AGE 35 TO 64
100.0/ 100
METRIC RATING
17th/ 347
METRIC RANK
10.9%
DISABILITY AGE 35 TO 64
83.5/ 100
METRIC RATING
146th/ 347
METRIC RANK
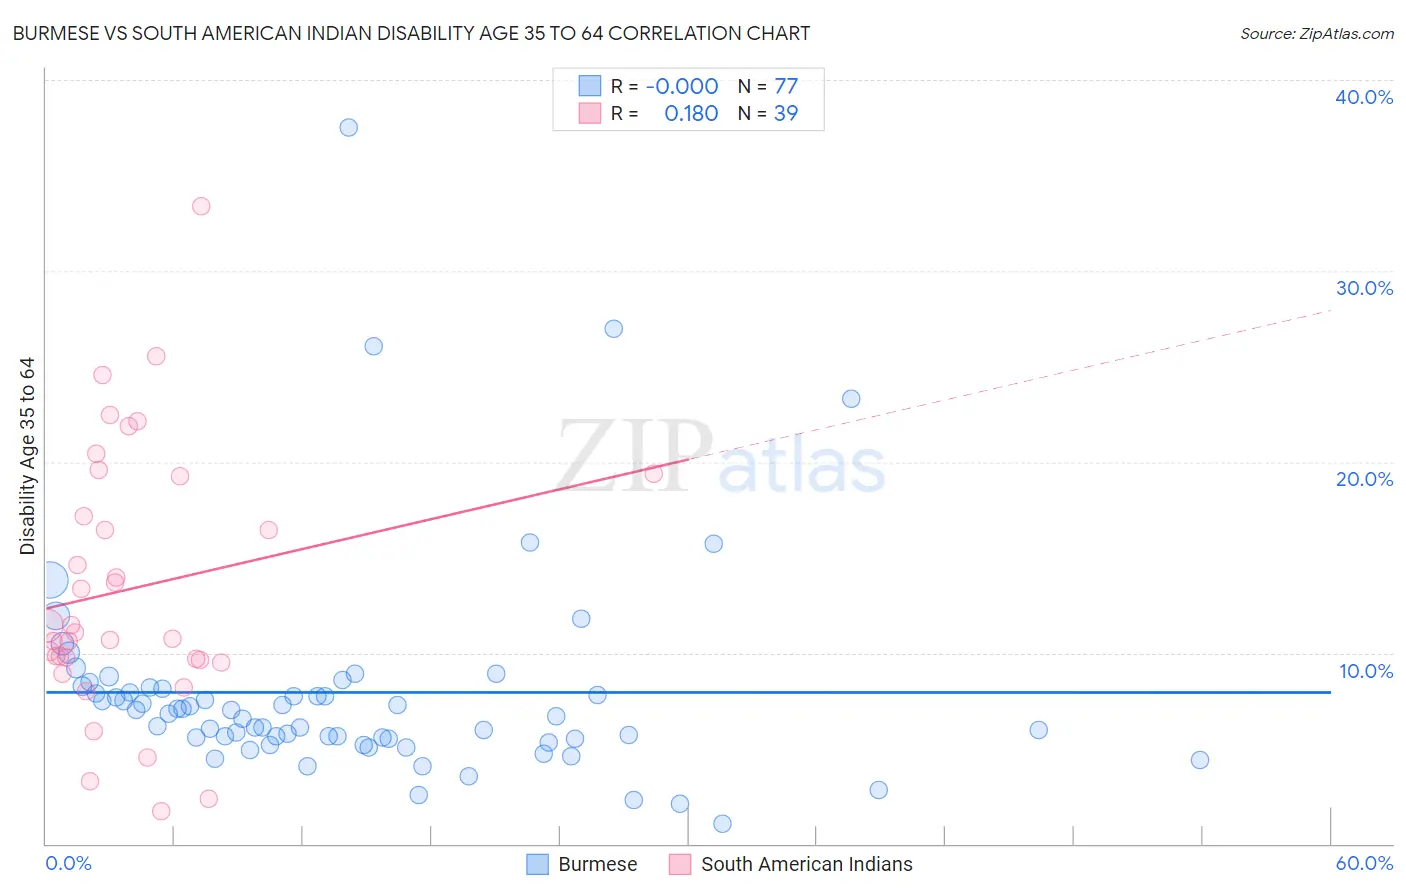
Burmese vs South American Indian Disability Age 35 to 64 Correlation Chart
The statistical analysis conducted on geographies consisting of 464,803,120 people shows no correlation between the proportion of Burmese and percentage of population with a disability between the ages 34 and 64 in the United States with a correlation coefficient (R) of -0.000 and weighted average of 9.2%. Similarly, the statistical analysis conducted on geographies consisting of 164,539,388 people shows a poor positive correlation between the proportion of South American Indians and percentage of population with a disability between the ages 34 and 64 in the United States with a correlation coefficient (R) of 0.180 and weighted average of 10.9%, a difference of 18.4%.
Disability Age 35 to 64 Correlation Summary
| Measurement | Burmese | South American Indian |
| Minimum | 1.0% | 1.7% |
| Maximum | 37.5% | 33.4% |
| Range | 36.5% | 31.7% |
| Mean | 7.9% | 13.4% |
| Median | 6.8% | 11.1% |
| Interquartile 25% (IQ1) | 5.5% | 9.6% |
| Interquartile 75% (IQ3) | 8.2% | 19.3% |
| Interquartile Range (IQR) | 2.6% | 9.6% |
| Standard Deviation (Sample) | 5.6% | 6.9% |
| Standard Deviation (Population) | 5.6% | 6.8% |
Similar Demographics by Disability Age 35 to 64
Demographics Similar to Burmese by Disability Age 35 to 64
In terms of disability age 35 to 64, the demographic groups most similar to Burmese are Soviet Union (9.2%, a difference of 0.41%), Immigrants from Venezuela (9.3%, a difference of 0.65%), Immigrants from Argentina (9.3%, a difference of 1.2%), Okinawan (9.4%, a difference of 1.6%), and Cypriot (9.4%, a difference of 1.6%).
| Demographics | Rating | Rank | Disability Age 35 to 64 |
| Immigrants | Bolivia | 100.0 /100 | #10 | Exceptional 8.7% |
| Immigrants | Eastern Asia | 100.0 /100 | #11 | Exceptional 8.8% |
| Indians (Asian) | 100.0 /100 | #12 | Exceptional 8.9% |
| Immigrants | South Central Asia | 100.0 /100 | #13 | Exceptional 8.9% |
| Immigrants | Singapore | 100.0 /100 | #14 | Exceptional 8.9% |
| Bolivians | 100.0 /100 | #15 | Exceptional 8.9% |
| Immigrants | Korea | 100.0 /100 | #16 | Exceptional 9.0% |
| Burmese | 100.0 /100 | #17 | Exceptional 9.2% |
| Soviet Union | 100.0 /100 | #18 | Exceptional 9.2% |
| Immigrants | Venezuela | 100.0 /100 | #19 | Exceptional 9.3% |
| Immigrants | Argentina | 100.0 /100 | #20 | Exceptional 9.3% |
| Okinawans | 100.0 /100 | #21 | Exceptional 9.4% |
| Cypriots | 100.0 /100 | #22 | Exceptional 9.4% |
| Argentineans | 100.0 /100 | #23 | Exceptional 9.4% |
| Asians | 100.0 /100 | #24 | Exceptional 9.4% |
Demographics Similar to South American Indians by Disability Age 35 to 64
In terms of disability age 35 to 64, the demographic groups most similar to South American Indians are Immigrants from Eritrea (10.9%, a difference of 0.020%), Arab (10.9%, a difference of 0.12%), Immigrants from Bangladesh (10.9%, a difference of 0.34%), Immigrants from Cameroon (10.9%, a difference of 0.34%), and Syrian (11.0%, a difference of 0.51%).
| Demographics | Rating | Rank | Disability Age 35 to 64 |
| Costa Ricans | 91.4 /100 | #139 | Exceptional 10.7% |
| Immigrants | Scotland | 91.3 /100 | #140 | Exceptional 10.7% |
| Australians | 90.7 /100 | #141 | Exceptional 10.8% |
| Immigrants | Saudi Arabia | 90.6 /100 | #142 | Exceptional 10.8% |
| Sierra Leoneans | 89.7 /100 | #143 | Excellent 10.8% |
| Lithuanians | 88.7 /100 | #144 | Excellent 10.8% |
| Immigrants | Bangladesh | 85.6 /100 | #145 | Excellent 10.9% |
| South American Indians | 83.5 /100 | #146 | Excellent 10.9% |
| Immigrants | Eritrea | 83.4 /100 | #147 | Excellent 10.9% |
| Arabs | 82.7 /100 | #148 | Excellent 10.9% |
| Immigrants | Cameroon | 81.1 /100 | #149 | Excellent 10.9% |
| Syrians | 79.8 /100 | #150 | Good 11.0% |
| New Zealanders | 79.3 /100 | #151 | Good 11.0% |
| Ukrainians | 78.0 /100 | #152 | Good 11.0% |
| Immigrants | England | 77.4 /100 | #153 | Good 11.0% |