Burmese vs Apache Disability Age Under 5
COMPARE
Burmese
Apache
Disability Age Under 5
Disability Age Under 5 Comparison
Burmese
Apache
1.1%
DISABILITY AGE UNDER 5
98.5/ 100
METRIC RATING
72nd/ 347
METRIC RANK
2.0%
DISABILITY AGE UNDER 5
0.0/ 100
METRIC RATING
337th/ 347
METRIC RANK
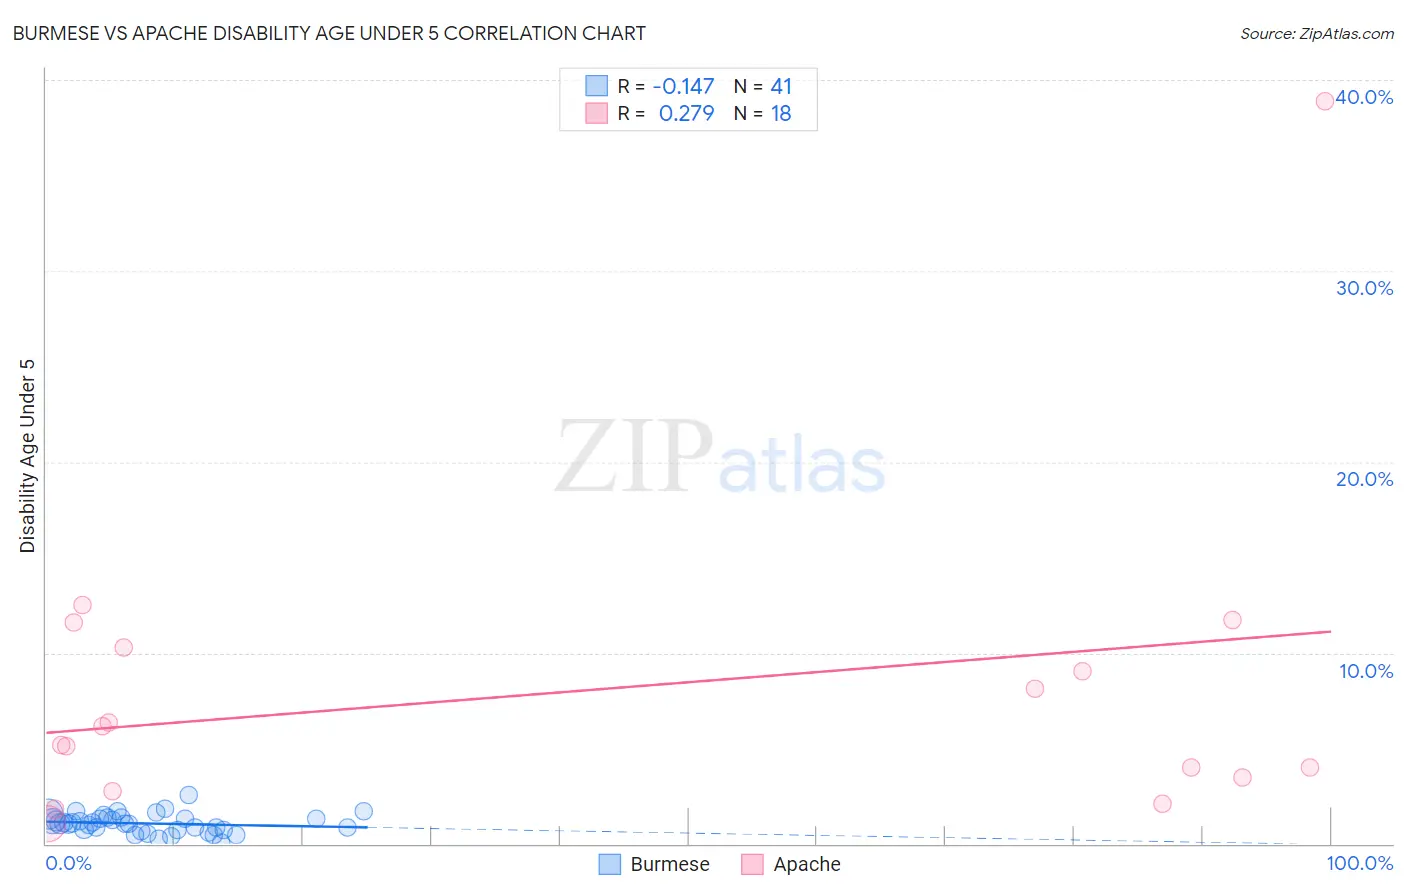
Burmese vs Apache Disability Age Under 5 Correlation Chart
The statistical analysis conducted on geographies consisting of 238,564,185 people shows a poor negative correlation between the proportion of Burmese and percentage of population with a disability under the age of 5 in the United States with a correlation coefficient (R) of -0.147 and weighted average of 1.1%. Similarly, the statistical analysis conducted on geographies consisting of 152,093,425 people shows a weak positive correlation between the proportion of Apache and percentage of population with a disability under the age of 5 in the United States with a correlation coefficient (R) of 0.279 and weighted average of 2.0%, a difference of 81.0%.
Disability Age Under 5 Correlation Summary
| Measurement | Burmese | Apache |
| Minimum | 0.058% | 1.1% |
| Maximum | 2.5% | 38.9% |
| Range | 2.5% | 37.8% |
| Mean | 1.1% | 8.0% |
| Median | 1.1% | 5.7% |
| Interquartile 25% (IQ1) | 0.72% | 3.5% |
| Interquartile 75% (IQ3) | 1.4% | 10.3% |
| Interquartile Range (IQR) | 0.63% | 6.8% |
| Standard Deviation (Sample) | 0.49% | 8.5% |
| Standard Deviation (Population) | 0.48% | 8.3% |
Similar Demographics by Disability Age Under 5
Demographics Similar to Burmese by Disability Age Under 5
In terms of disability age under 5, the demographic groups most similar to Burmese are Immigrants from Sri Lanka (1.1%, a difference of 0.080%), Jordanian (1.1%, a difference of 0.090%), Trinidadian and Tobagonian (1.1%, a difference of 0.16%), Immigrants from Pakistan (1.1%, a difference of 0.17%), and Immigrants from Ecuador (1.1%, a difference of 0.22%).
| Demographics | Rating | Rank | Disability Age Under 5 |
| Immigrants | Korea | 98.8 /100 | #65 | Exceptional 1.1% |
| Immigrants | Indonesia | 98.7 /100 | #66 | Exceptional 1.1% |
| Immigrants | Belize | 98.7 /100 | #67 | Exceptional 1.1% |
| South Africans | 98.7 /100 | #68 | Exceptional 1.1% |
| Israelis | 98.7 /100 | #69 | Exceptional 1.1% |
| Immigrants | Ecuador | 98.6 /100 | #70 | Exceptional 1.1% |
| Trinidadians and Tobagonians | 98.6 /100 | #71 | Exceptional 1.1% |
| Burmese | 98.5 /100 | #72 | Exceptional 1.1% |
| Immigrants | Sri Lanka | 98.5 /100 | #73 | Exceptional 1.1% |
| Jordanians | 98.5 /100 | #74 | Exceptional 1.1% |
| Immigrants | Pakistan | 98.4 /100 | #75 | Exceptional 1.1% |
| Immigrants | Burma/Myanmar | 98.2 /100 | #76 | Exceptional 1.1% |
| Immigrants | Denmark | 98.1 /100 | #77 | Exceptional 1.1% |
| West Indians | 98.0 /100 | #78 | Exceptional 1.1% |
| Hmong | 98.0 /100 | #79 | Exceptional 1.1% |
Demographics Similar to Apache by Disability Age Under 5
In terms of disability age under 5, the demographic groups most similar to Apache are Paraguayan (2.0%, a difference of 2.9%), Pennsylvania German (1.9%, a difference of 4.2%), Native/Alaskan (1.9%, a difference of 4.6%), Dutch West Indian (1.9%, a difference of 5.0%), and Tohono O'odham (2.2%, a difference of 7.6%).
| Demographics | Rating | Rank | Disability Age Under 5 |
| Choctaw | 0.0 /100 | #330 | Tragic 1.9% |
| French Canadians | 0.0 /100 | #331 | Tragic 1.9% |
| Chippewa | 0.0 /100 | #332 | Tragic 1.9% |
| Dutch West Indians | 0.0 /100 | #333 | Tragic 1.9% |
| Natives/Alaskans | 0.0 /100 | #334 | Tragic 1.9% |
| Pennsylvania Germans | 0.0 /100 | #335 | Tragic 1.9% |
| Paraguayans | 0.0 /100 | #336 | Tragic 2.0% |
| Apache | 0.0 /100 | #337 | Tragic 2.0% |
| Tohono O'odham | 0.0 /100 | #338 | Tragic 2.2% |
| Immigrants | Azores | 0.0 /100 | #339 | Tragic 2.2% |
| Menominee | 0.0 /100 | #340 | Tragic 2.3% |
| Tsimshian | 0.0 /100 | #341 | Tragic 2.4% |
| Alaska Natives | 0.0 /100 | #342 | Tragic 2.9% |
| Colville | 0.0 /100 | #343 | Tragic 3.3% |
| Inupiat | 0.0 /100 | #344 | Tragic 3.7% |