Bulgarian vs Immigrants from Norway Disability
COMPARE
Bulgarian
Immigrants from Norway
Disability
Disability Comparison
Bulgarians
Immigrants from Norway
11.0%
DISABILITY
99.6/ 100
METRIC RATING
65th/ 347
METRIC RANK
11.6%
DISABILITY
73.2/ 100
METRIC RATING
149th/ 347
METRIC RANK
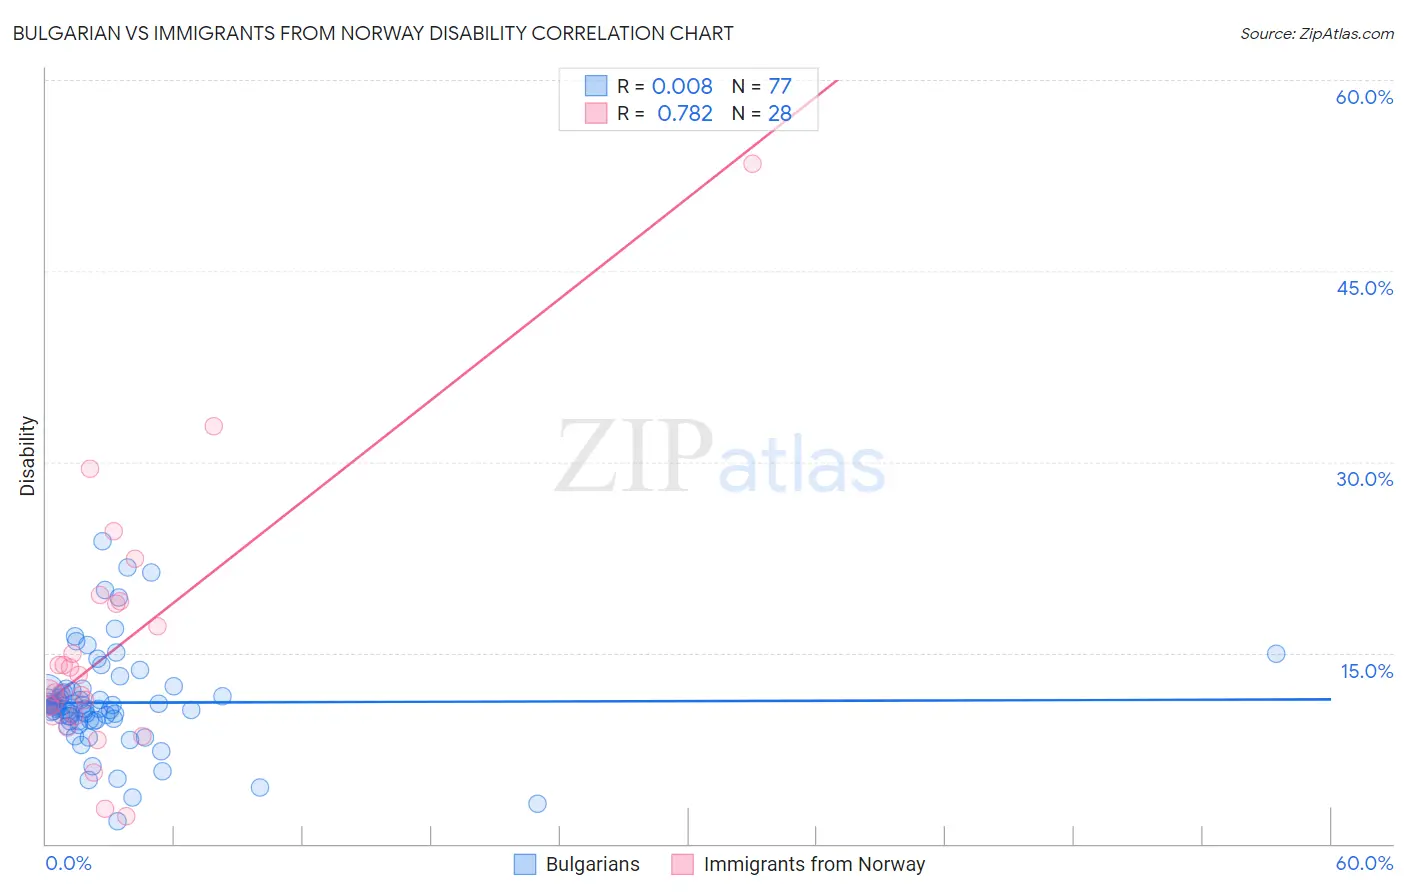
Bulgarian vs Immigrants from Norway Disability Correlation Chart
The statistical analysis conducted on geographies consisting of 205,630,627 people shows no correlation between the proportion of Bulgarians and percentage of population with a disability in the United States with a correlation coefficient (R) of 0.008 and weighted average of 11.0%. Similarly, the statistical analysis conducted on geographies consisting of 116,706,473 people shows a strong positive correlation between the proportion of Immigrants from Norway and percentage of population with a disability in the United States with a correlation coefficient (R) of 0.782 and weighted average of 11.6%, a difference of 5.4%.
Disability Correlation Summary
| Measurement | Bulgarian | Immigrants from Norway |
| Minimum | 1.8% | 2.2% |
| Maximum | 23.7% | 53.4% |
| Range | 21.9% | 51.2% |
| Mean | 11.1% | 15.4% |
| Median | 10.7% | 12.6% |
| Interquartile 25% (IQ1) | 9.7% | 10.0% |
| Interquartile 75% (IQ3) | 11.9% | 18.9% |
| Interquartile Range (IQR) | 2.3% | 8.9% |
| Standard Deviation (Sample) | 3.9% | 10.3% |
| Standard Deviation (Population) | 3.9% | 10.1% |
Similar Demographics by Disability
Demographics Similar to Bulgarians by Disability
In terms of disability, the demographic groups most similar to Bulgarians are Laotian (11.0%, a difference of 0.010%), Immigrants from Sweden (11.0%, a difference of 0.020%), Colombian (11.0%, a difference of 0.10%), Immigrants from Eritrea (11.0%, a difference of 0.20%), and Immigrants from Northern Africa (10.9%, a difference of 0.22%).
| Demographics | Rating | Rank | Disability |
| Immigrants | South America | 99.8 /100 | #58 | Exceptional 10.9% |
| Immigrants | Colombia | 99.7 /100 | #59 | Exceptional 10.9% |
| Zimbabweans | 99.7 /100 | #60 | Exceptional 10.9% |
| Immigrants | Bulgaria | 99.7 /100 | #61 | Exceptional 10.9% |
| Immigrants | Northern Africa | 99.7 /100 | #62 | Exceptional 10.9% |
| Immigrants | Eritrea | 99.7 /100 | #63 | Exceptional 11.0% |
| Immigrants | Sweden | 99.6 /100 | #64 | Exceptional 11.0% |
| Bulgarians | 99.6 /100 | #65 | Exceptional 11.0% |
| Laotians | 99.6 /100 | #66 | Exceptional 11.0% |
| Colombians | 99.6 /100 | #67 | Exceptional 11.0% |
| Immigrants | Afghanistan | 99.6 /100 | #68 | Exceptional 11.0% |
| Sri Lankans | 99.5 /100 | #69 | Exceptional 11.0% |
| Immigrants | France | 99.4 /100 | #70 | Exceptional 11.0% |
| Immigrants | Lebanon | 99.4 /100 | #71 | Exceptional 11.0% |
| Immigrants | Chile | 99.4 /100 | #72 | Exceptional 11.0% |
Demographics Similar to Immigrants from Norway by Disability
In terms of disability, the demographic groups most similar to Immigrants from Norway are Romanian (11.6%, a difference of 0.030%), Immigrants from Kenya (11.6%, a difference of 0.060%), Immigrants from Moldova (11.6%, a difference of 0.060%), Immigrants from Ghana (11.6%, a difference of 0.11%), and Immigrants from Guatemala (11.6%, a difference of 0.11%).
| Demographics | Rating | Rank | Disability |
| Immigrants | Sudan | 85.3 /100 | #142 | Excellent 11.5% |
| Moroccans | 83.3 /100 | #143 | Excellent 11.5% |
| Australians | 82.5 /100 | #144 | Excellent 11.5% |
| Nigerians | 81.3 /100 | #145 | Excellent 11.5% |
| Immigrants | Hungary | 79.0 /100 | #146 | Good 11.5% |
| Immigrants | Ukraine | 77.6 /100 | #147 | Good 11.5% |
| Sudanese | 77.1 /100 | #148 | Good 11.5% |
| Immigrants | Norway | 73.2 /100 | #149 | Good 11.6% |
| Romanians | 72.7 /100 | #150 | Good 11.6% |
| Immigrants | Kenya | 72.1 /100 | #151 | Good 11.6% |
| Immigrants | Moldova | 72.0 /100 | #152 | Good 11.6% |
| Immigrants | Ghana | 71.2 /100 | #153 | Good 11.6% |
| Immigrants | Guatemala | 71.1 /100 | #154 | Good 11.6% |
| Immigrants | Netherlands | 69.8 /100 | #155 | Good 11.6% |
| Immigrants | Fiji | 69.5 /100 | #156 | Good 11.6% |