Uruguayan vs Assyrian/Chaldean/Syriac Disability Age 18 to 34
COMPARE
Uruguayan
Assyrian/Chaldean/Syriac
Disability Age 18 to 34
Disability Age 18 to 34 Comparison
Uruguayans
Assyrians/Chaldeans/Syriacs
6.2%
DISABILITY AGE 18 TO 34
97.3/ 100
METRIC RATING
97th/ 347
METRIC RANK
6.1%
DISABILITY AGE 18 TO 34
98.9/ 100
METRIC RATING
78th/ 347
METRIC RANK
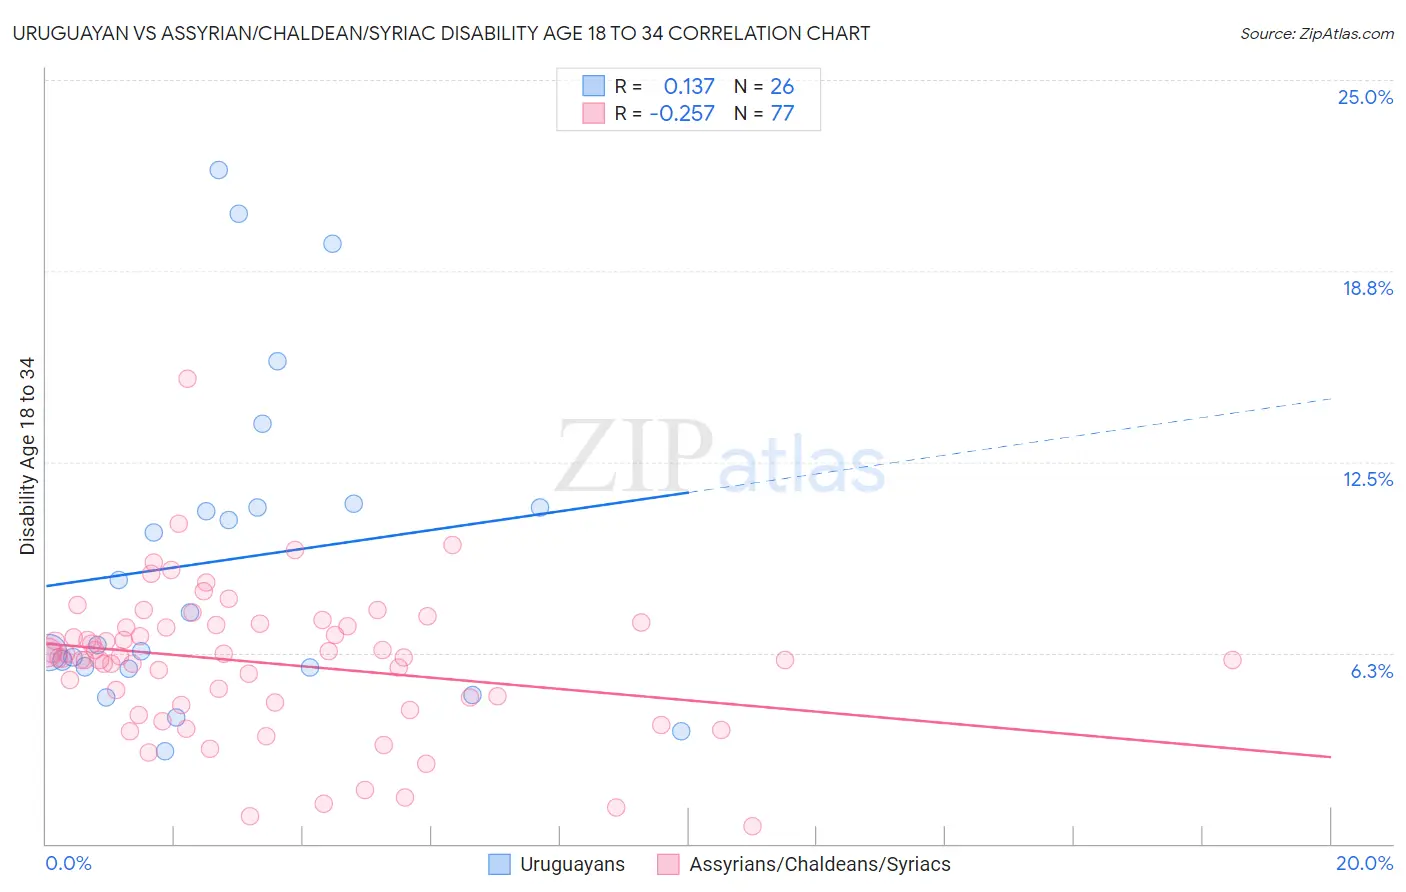
Uruguayan vs Assyrian/Chaldean/Syriac Disability Age 18 to 34 Correlation Chart
The statistical analysis conducted on geographies consisting of 144,733,495 people shows a poor positive correlation between the proportion of Uruguayans and percentage of population with a disability between the ages 18 and 35 in the United States with a correlation coefficient (R) of 0.137 and weighted average of 6.2%. Similarly, the statistical analysis conducted on geographies consisting of 110,269,916 people shows a weak negative correlation between the proportion of Assyrians/Chaldeans/Syriacs and percentage of population with a disability between the ages 18 and 35 in the United States with a correlation coefficient (R) of -0.257 and weighted average of 6.1%, a difference of 1.7%.
Disability Age 18 to 34 Correlation Summary
| Measurement | Uruguayan | Assyrian/Chaldean/Syriac |
| Minimum | 3.0% | 0.58% |
| Maximum | 22.1% | 15.2% |
| Range | 19.0% | 14.6% |
| Mean | 9.3% | 5.9% |
| Median | 7.0% | 6.1% |
| Interquartile 25% (IQ1) | 5.8% | 4.6% |
| Interquartile 75% (IQ3) | 11.0% | 7.1% |
| Interquartile Range (IQR) | 5.2% | 2.5% |
| Standard Deviation (Sample) | 5.3% | 2.4% |
| Standard Deviation (Population) | 5.2% | 2.3% |
Demographics Similar to Uruguayans and Assyrians/Chaldeans/Syriacs by Disability Age 18 to 34
In terms of disability age 18 to 34, the demographic groups most similar to Uruguayans are Immigrants from Uruguay (6.2%, a difference of 0.080%), Central American (6.2%, a difference of 0.13%), Immigrants from Kazakhstan (6.2%, a difference of 0.16%), Immigrants (6.2%, a difference of 0.21%), and Jordanian (6.2%, a difference of 0.23%). Similarly, the demographic groups most similar to Assyrians/Chaldeans/Syriacs are Immigrants from Russia (6.1%, a difference of 0.0%), Afghan (6.1%, a difference of 0.29%), Immigrants from Chile (6.1%, a difference of 0.49%), Immigrants from Australia (6.1%, a difference of 0.53%), and Immigrants from Northern Africa (6.1%, a difference of 0.71%).
| Demographics | Rating | Rank | Disability Age 18 to 34 |
| Immigrants | Russia | 98.9 /100 | #77 | Exceptional 6.1% |
| Assyrians/Chaldeans/Syriacs | 98.9 /100 | #78 | Exceptional 6.1% |
| Afghans | 98.7 /100 | #79 | Exceptional 6.1% |
| Immigrants | Chile | 98.5 /100 | #80 | Exceptional 6.1% |
| Immigrants | Australia | 98.5 /100 | #81 | Exceptional 6.1% |
| Immigrants | Northern Africa | 98.4 /100 | #82 | Exceptional 6.1% |
| Barbadians | 98.3 /100 | #83 | Exceptional 6.1% |
| Israelis | 98.3 /100 | #84 | Exceptional 6.1% |
| Immigrants | Ireland | 98.2 /100 | #85 | Exceptional 6.1% |
| Immigrants | Kuwait | 98.0 /100 | #86 | Exceptional 6.2% |
| Immigrants | Eastern Europe | 97.9 /100 | #87 | Exceptional 6.2% |
| Cambodians | 97.8 /100 | #88 | Exceptional 6.2% |
| Turks | 97.8 /100 | #89 | Exceptional 6.2% |
| Immigrants | Vietnam | 97.7 /100 | #90 | Exceptional 6.2% |
| Immigrants | Philippines | 97.6 /100 | #91 | Exceptional 6.2% |
| Jordanians | 97.6 /100 | #92 | Exceptional 6.2% |
| Immigrants | Immigrants | 97.6 /100 | #93 | Exceptional 6.2% |
| Immigrants | Kazakhstan | 97.5 /100 | #94 | Exceptional 6.2% |
| Central Americans | 97.5 /100 | #95 | Exceptional 6.2% |
| Immigrants | Uruguay | 97.4 /100 | #96 | Exceptional 6.2% |
| Uruguayans | 97.3 /100 | #97 | Exceptional 6.2% |