Bulgarian vs Assyrian/Chaldean/Syriac Disability Age 18 to 34
COMPARE
Bulgarian
Assyrian/Chaldean/Syriac
Disability Age 18 to 34
Disability Age 18 to 34 Comparison
Bulgarians
Assyrians/Chaldeans/Syriacs
6.5%
DISABILITY AGE 18 TO 34
78.3/ 100
METRIC RATING
152nd/ 347
METRIC RANK
6.1%
DISABILITY AGE 18 TO 34
98.9/ 100
METRIC RATING
78th/ 347
METRIC RANK
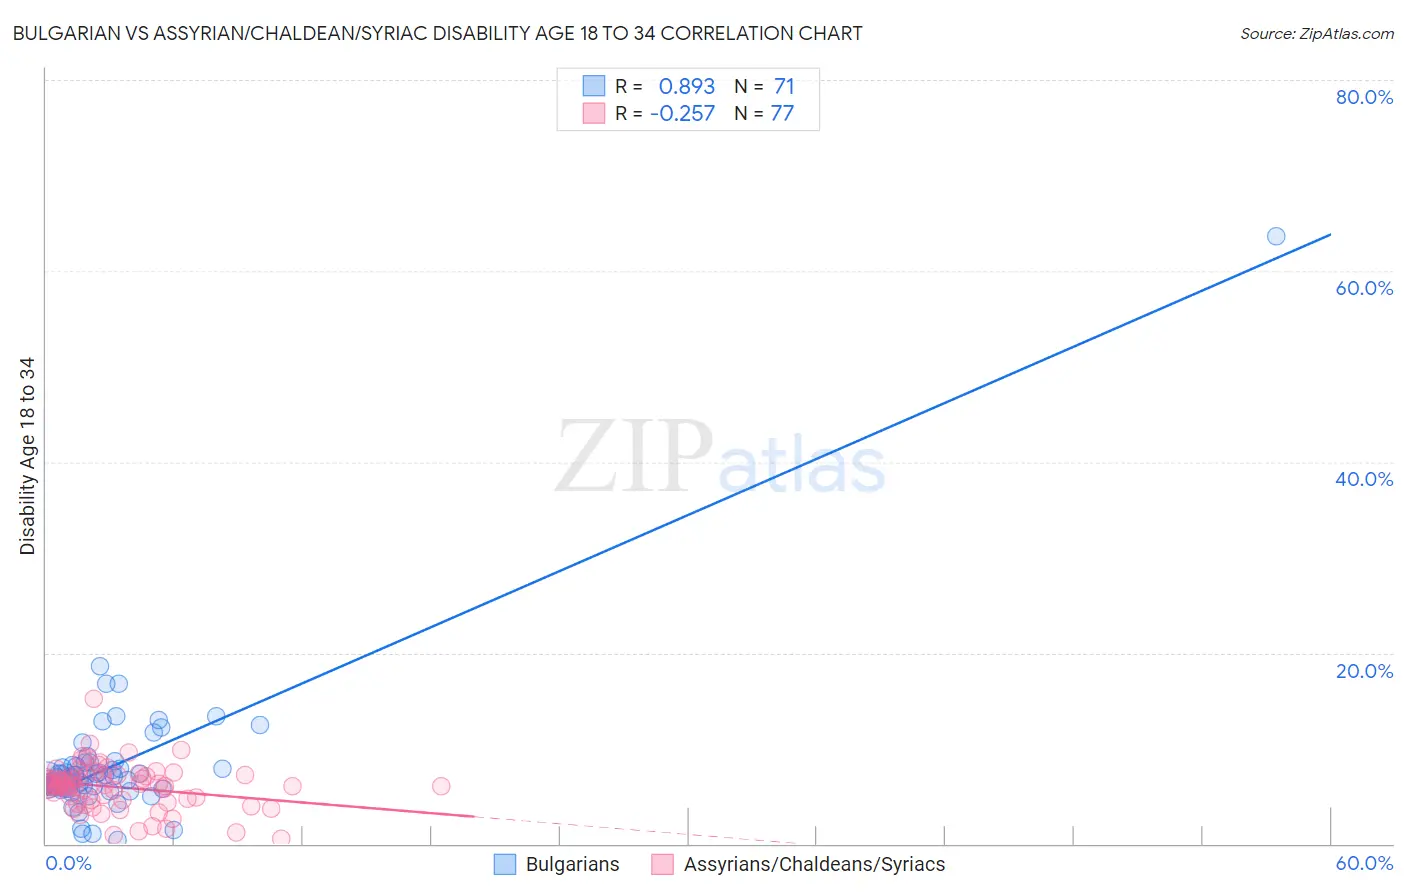
Bulgarian vs Assyrian/Chaldean/Syriac Disability Age 18 to 34 Correlation Chart
The statistical analysis conducted on geographies consisting of 205,383,127 people shows a very strong positive correlation between the proportion of Bulgarians and percentage of population with a disability between the ages 18 and 35 in the United States with a correlation coefficient (R) of 0.893 and weighted average of 6.5%. Similarly, the statistical analysis conducted on geographies consisting of 110,269,916 people shows a weak negative correlation between the proportion of Assyrians/Chaldeans/Syriacs and percentage of population with a disability between the ages 18 and 35 in the United States with a correlation coefficient (R) of -0.257 and weighted average of 6.1%, a difference of 6.0%.
Disability Age 18 to 34 Correlation Summary
| Measurement | Bulgarian | Assyrian/Chaldean/Syriac |
| Minimum | 0.34% | 0.58% |
| Maximum | 63.6% | 15.2% |
| Range | 63.3% | 14.6% |
| Mean | 8.1% | 5.9% |
| Median | 6.7% | 6.1% |
| Interquartile 25% (IQ1) | 5.8% | 4.6% |
| Interquartile 75% (IQ3) | 8.1% | 7.1% |
| Interquartile Range (IQR) | 2.3% | 2.5% |
| Standard Deviation (Sample) | 7.5% | 2.4% |
| Standard Deviation (Population) | 7.5% | 2.3% |
Similar Demographics by Disability Age 18 to 34
Demographics Similar to Bulgarians by Disability Age 18 to 34
In terms of disability age 18 to 34, the demographic groups most similar to Bulgarians are Immigrants from Eritrea (6.5%, a difference of 0.090%), Immigrants from Central America (6.5%, a difference of 0.16%), Inupiat (6.5%, a difference of 0.16%), Immigrants from Panama (6.5%, a difference of 0.29%), and Immigrants from Sierra Leone (6.5%, a difference of 0.32%).
| Demographics | Rating | Rank | Disability Age 18 to 34 |
| Moroccans | 85.2 /100 | #145 | Excellent 6.4% |
| Belizeans | 84.9 /100 | #146 | Excellent 6.4% |
| Immigrants | South Africa | 83.7 /100 | #147 | Excellent 6.4% |
| Immigrants | Belgium | 83.5 /100 | #148 | Excellent 6.4% |
| Hondurans | 83.1 /100 | #149 | Excellent 6.4% |
| Immigrants | Dominican Republic | 82.7 /100 | #150 | Excellent 6.4% |
| Tongans | 81.9 /100 | #151 | Excellent 6.4% |
| Bulgarians | 78.3 /100 | #152 | Good 6.5% |
| Immigrants | Eritrea | 77.4 /100 | #153 | Good 6.5% |
| Immigrants | Central America | 76.8 /100 | #154 | Good 6.5% |
| Inupiat | 76.7 /100 | #155 | Good 6.5% |
| Immigrants | Panama | 75.3 /100 | #156 | Good 6.5% |
| Immigrants | Sierra Leone | 75.0 /100 | #157 | Good 6.5% |
| Zimbabweans | 74.7 /100 | #158 | Good 6.5% |
| Dominicans | 73.6 /100 | #159 | Good 6.5% |
Demographics Similar to Assyrians/Chaldeans/Syriacs by Disability Age 18 to 34
In terms of disability age 18 to 34, the demographic groups most similar to Assyrians/Chaldeans/Syriacs are Immigrants from Russia (6.1%, a difference of 0.0%), Immigrants from Western Asia (6.1%, a difference of 0.10%), Afghan (6.1%, a difference of 0.29%), Immigrants from Turkey (6.1%, a difference of 0.38%), and Immigrants from Chile (6.1%, a difference of 0.49%).
| Demographics | Rating | Rank | Disability Age 18 to 34 |
| Immigrants | Japan | 99.3 /100 | #71 | Exceptional 6.0% |
| Immigrants | Lebanon | 99.2 /100 | #72 | Exceptional 6.0% |
| Cypriots | 99.2 /100 | #73 | Exceptional 6.0% |
| Haitians | 99.2 /100 | #74 | Exceptional 6.0% |
| Immigrants | Turkey | 99.1 /100 | #75 | Exceptional 6.1% |
| Immigrants | Western Asia | 98.9 /100 | #76 | Exceptional 6.1% |
| Immigrants | Russia | 98.9 /100 | #77 | Exceptional 6.1% |
| Assyrians/Chaldeans/Syriacs | 98.9 /100 | #78 | Exceptional 6.1% |
| Afghans | 98.7 /100 | #79 | Exceptional 6.1% |
| Immigrants | Chile | 98.5 /100 | #80 | Exceptional 6.1% |
| Immigrants | Australia | 98.5 /100 | #81 | Exceptional 6.1% |
| Immigrants | Northern Africa | 98.4 /100 | #82 | Exceptional 6.1% |
| Barbadians | 98.3 /100 | #83 | Exceptional 6.1% |
| Israelis | 98.3 /100 | #84 | Exceptional 6.1% |
| Immigrants | Ireland | 98.2 /100 | #85 | Exceptional 6.1% |