Creek vs Syrian Disability Age Over 75
COMPARE
Creek
Syrian
Disability Age Over 75
Disability Age Over 75 Comparison
Creek
Syrians
51.5%
DISABILITY AGE OVER 75
0.0/ 100
METRIC RATING
319th/ 347
METRIC RANK
46.7%
DISABILITY AGE OVER 75
91.1/ 100
METRIC RATING
127th/ 347
METRIC RANK
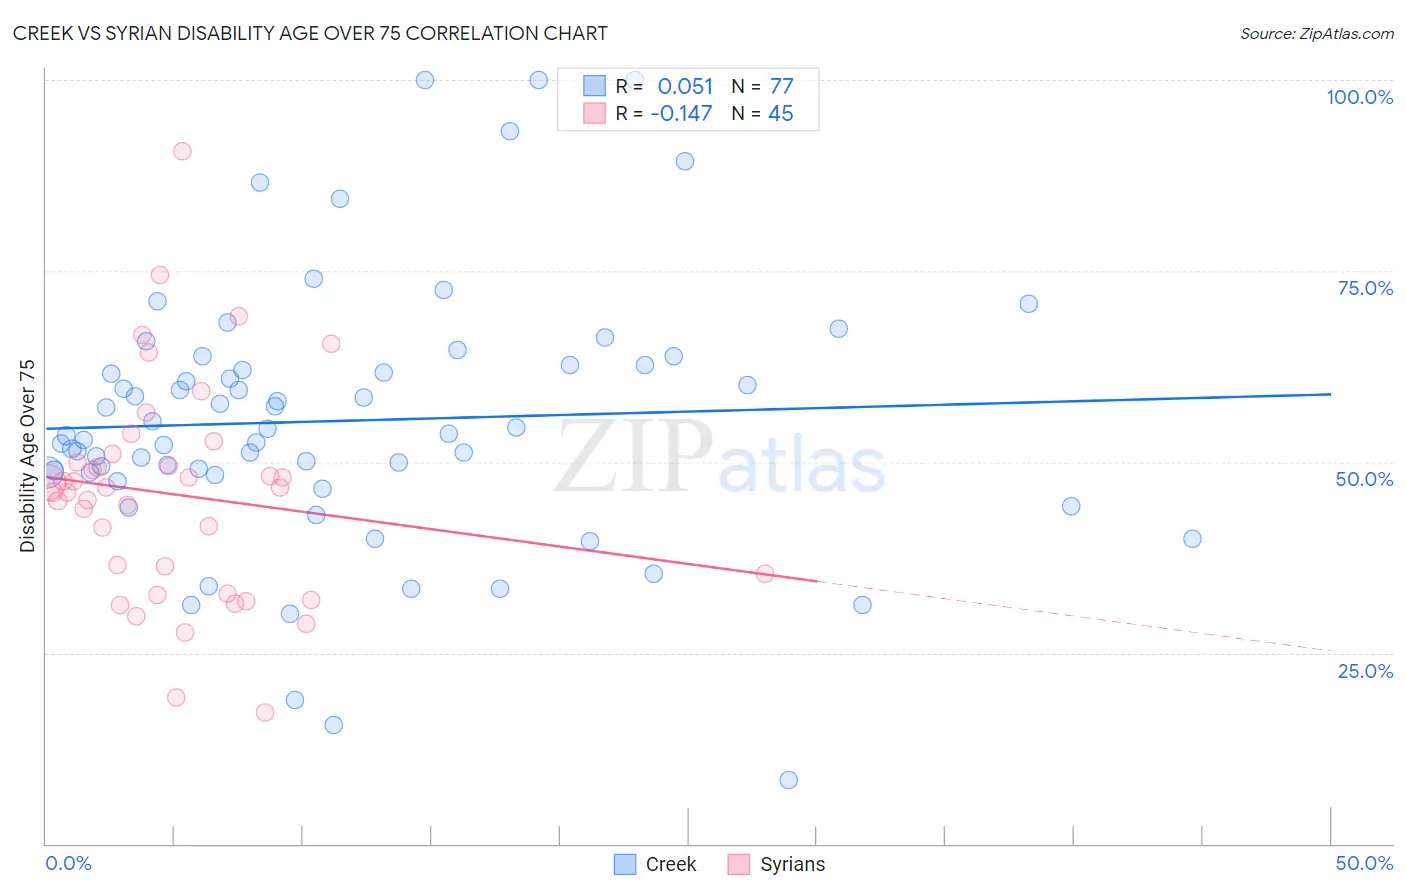
Creek vs Syrian Disability Age Over 75 Correlation Chart
The statistical analysis conducted on geographies consisting of 178,338,253 people shows a slight positive correlation between the proportion of Creek and percentage of population with a disability over the age of 75 in the United States with a correlation coefficient (R) of 0.051 and weighted average of 51.5%. Similarly, the statistical analysis conducted on geographies consisting of 266,003,851 people shows a poor negative correlation between the proportion of Syrians and percentage of population with a disability over the age of 75 in the United States with a correlation coefficient (R) of -0.147 and weighted average of 46.7%, a difference of 10.1%.
Disability Age Over 75 Correlation Summary
| Measurement | Creek | Syrian |
| Minimum | 8.3% | 17.1% |
| Maximum | 100.0% | 90.6% |
| Range | 91.7% | 73.5% |
| Mean | 55.4% | 45.7% |
| Median | 53.7% | 46.6% |
| Interquartile 25% (IQ1) | 48.5% | 34.1% |
| Interquartile 75% (IQ3) | 62.7% | 50.5% |
| Interquartile Range (IQR) | 14.2% | 16.5% |
| Standard Deviation (Sample) | 17.5% | 14.2% |
| Standard Deviation (Population) | 17.4% | 14.1% |
Similar Demographics by Disability Age Over 75
Demographics Similar to Creek by Disability Age Over 75
In terms of disability age over 75, the demographic groups most similar to Creek are Seminole (51.5%, a difference of 0.0%), Paiute (51.5%, a difference of 0.14%), Dutch West Indian (51.5%, a difference of 0.15%), Yakama (51.3%, a difference of 0.33%), and Comanche (51.7%, a difference of 0.48%).
| Demographics | Rating | Rank | Disability Age Over 75 |
| Cheyenne | 0.0 /100 | #312 | Tragic 50.9% |
| Immigrants | Azores | 0.0 /100 | #313 | Tragic 50.9% |
| Immigrants | Mexico | 0.0 /100 | #314 | Tragic 51.1% |
| Mexicans | 0.0 /100 | #315 | Tragic 51.1% |
| Chickasaw | 0.0 /100 | #316 | Tragic 51.2% |
| Yakama | 0.0 /100 | #317 | Tragic 51.3% |
| Seminole | 0.0 /100 | #318 | Tragic 51.5% |
| Creek | 0.0 /100 | #319 | Tragic 51.5% |
| Paiute | 0.0 /100 | #320 | Tragic 51.5% |
| Dutch West Indians | 0.0 /100 | #321 | Tragic 51.5% |
| Comanche | 0.0 /100 | #322 | Tragic 51.7% |
| Immigrants | Yemen | 0.0 /100 | #323 | Tragic 52.0% |
| Menominee | 0.0 /100 | #324 | Tragic 52.3% |
| Immigrants | Cabo Verde | 0.0 /100 | #325 | Tragic 52.4% |
| Ute | 0.0 /100 | #326 | Tragic 52.6% |
Demographics Similar to Syrians by Disability Age Over 75
In terms of disability age over 75, the demographic groups most similar to Syrians are European (46.7%, a difference of 0.010%), Colombian (46.7%, a difference of 0.020%), Icelander (46.7%, a difference of 0.020%), Immigrants from Germany (46.7%, a difference of 0.020%), and Immigrants from Northern Africa (46.7%, a difference of 0.030%).
| Demographics | Rating | Rank | Disability Age Over 75 |
| Immigrants | Nepal | 94.1 /100 | #120 | Exceptional 46.6% |
| Scandinavians | 93.6 /100 | #121 | Exceptional 46.6% |
| Immigrants | Albania | 93.2 /100 | #122 | Exceptional 46.6% |
| Immigrants | Colombia | 92.6 /100 | #123 | Exceptional 46.7% |
| Immigrants | South America | 91.8 /100 | #124 | Exceptional 46.7% |
| Colombians | 91.3 /100 | #125 | Exceptional 46.7% |
| Europeans | 91.2 /100 | #126 | Exceptional 46.7% |
| Syrians | 91.1 /100 | #127 | Exceptional 46.7% |
| Icelanders | 90.9 /100 | #128 | Exceptional 46.7% |
| Immigrants | Germany | 90.8 /100 | #129 | Exceptional 46.7% |
| Immigrants | Northern Africa | 90.7 /100 | #130 | Exceptional 46.7% |
| Scottish | 90.5 /100 | #131 | Exceptional 46.7% |
| South Americans | 90.0 /100 | #132 | Excellent 46.8% |
| English | 89.4 /100 | #133 | Excellent 46.8% |
| Immigrants | Ethiopia | 89.1 /100 | #134 | Excellent 46.8% |