Basque vs Dominican Disability Age 18 to 34
COMPARE
Basque
Dominican
Disability Age 18 to 34
Disability Age 18 to 34 Comparison
Basques
Dominicans
7.4%
DISABILITY AGE 18 TO 34
0.1/ 100
METRIC RATING
269th/ 347
METRIC RANK
6.5%
DISABILITY AGE 18 TO 34
73.6/ 100
METRIC RATING
159th/ 347
METRIC RANK
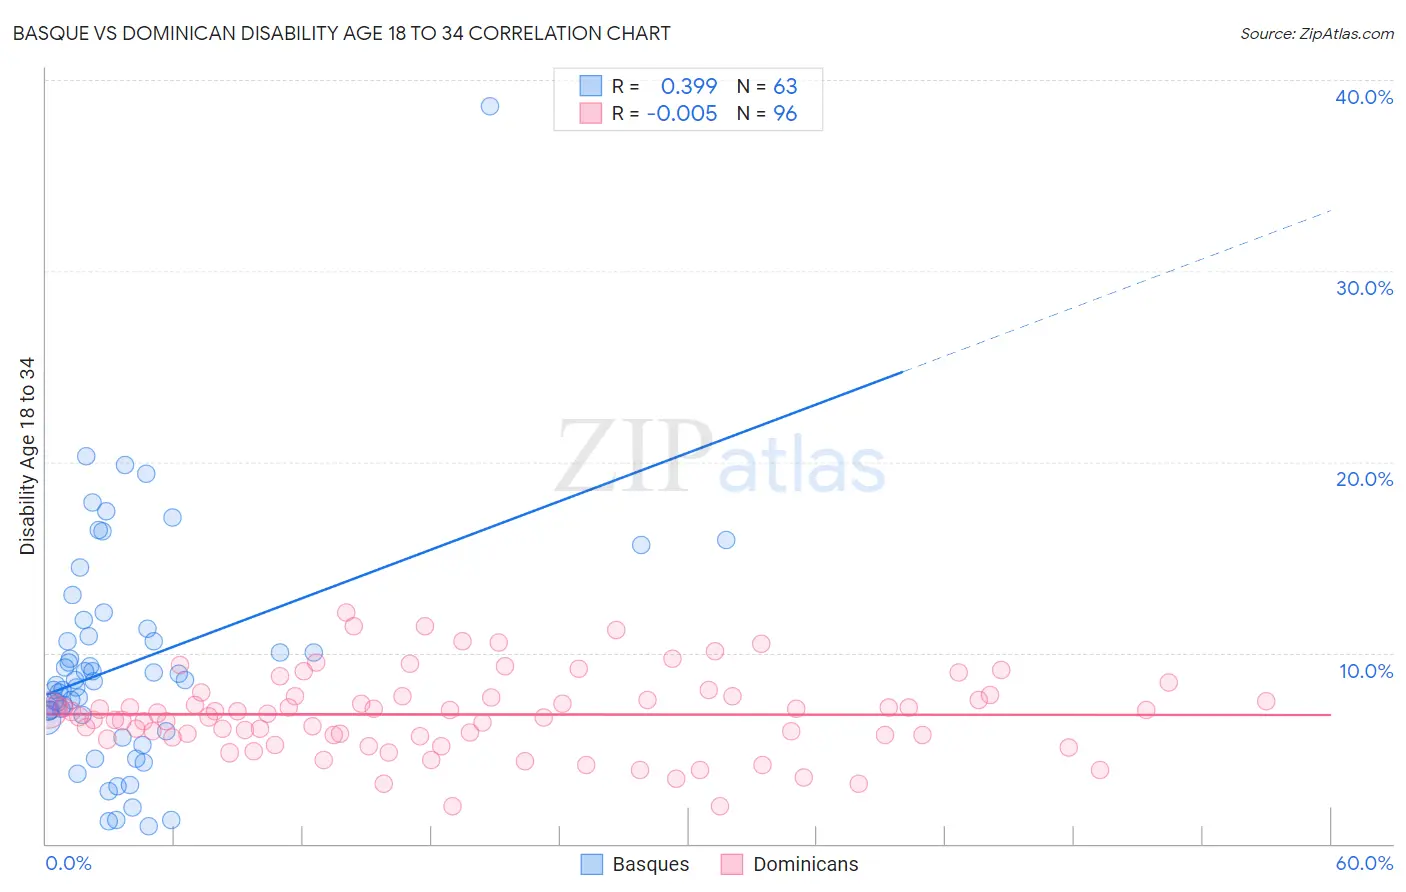
Basque vs Dominican Disability Age 18 to 34 Correlation Chart
The statistical analysis conducted on geographies consisting of 165,605,006 people shows a mild positive correlation between the proportion of Basques and percentage of population with a disability between the ages 18 and 35 in the United States with a correlation coefficient (R) of 0.399 and weighted average of 7.4%. Similarly, the statistical analysis conducted on geographies consisting of 354,342,196 people shows no correlation between the proportion of Dominicans and percentage of population with a disability between the ages 18 and 35 in the United States with a correlation coefficient (R) of -0.005 and weighted average of 6.5%, a difference of 13.8%.
Disability Age 18 to 34 Correlation Summary
| Measurement | Basque | Dominican |
| Minimum | 0.88% | 1.9% |
| Maximum | 38.6% | 12.1% |
| Range | 37.7% | 10.1% |
| Mean | 9.5% | 6.8% |
| Median | 8.5% | 6.8% |
| Interquartile 25% (IQ1) | 6.5% | 5.7% |
| Interquartile 75% (IQ3) | 11.2% | 7.7% |
| Interquartile Range (IQR) | 4.8% | 2.0% |
| Standard Deviation (Sample) | 6.1% | 2.1% |
| Standard Deviation (Population) | 6.0% | 2.1% |
Similar Demographics by Disability Age 18 to 34
Demographics Similar to Basques by Disability Age 18 to 34
In terms of disability age 18 to 34, the demographic groups most similar to Basques are Portuguese (7.4%, a difference of 0.040%), Belgian (7.4%, a difference of 0.090%), Bangladeshi (7.4%, a difference of 0.11%), Swiss (7.4%, a difference of 0.14%), and German Russian (7.4%, a difference of 0.18%).
| Demographics | Rating | Rank | Disability Age 18 to 34 |
| Canadians | 0.2 /100 | #262 | Tragic 7.3% |
| British | 0.2 /100 | #263 | Tragic 7.3% |
| Bermudans | 0.1 /100 | #264 | Tragic 7.3% |
| Slovenes | 0.1 /100 | #265 | Tragic 7.3% |
| German Russians | 0.1 /100 | #266 | Tragic 7.4% |
| Bangladeshis | 0.1 /100 | #267 | Tragic 7.4% |
| Portuguese | 0.1 /100 | #268 | Tragic 7.4% |
| Basques | 0.1 /100 | #269 | Tragic 7.4% |
| Belgians | 0.1 /100 | #270 | Tragic 7.4% |
| Swiss | 0.1 /100 | #271 | Tragic 7.4% |
| Tsimshian | 0.1 /100 | #272 | Tragic 7.4% |
| Slavs | 0.1 /100 | #273 | Tragic 7.4% |
| Africans | 0.1 /100 | #274 | Tragic 7.4% |
| Immigrants | Somalia | 0.1 /100 | #275 | Tragic 7.4% |
| Europeans | 0.1 /100 | #276 | Tragic 7.4% |
Demographics Similar to Dominicans by Disability Age 18 to 34
In terms of disability age 18 to 34, the demographic groups most similar to Dominicans are Immigrants from Southern Europe (6.5%, a difference of 0.090%), Zimbabwean (6.5%, a difference of 0.11%), Arab (6.5%, a difference of 0.11%), Immigrants from Sierra Leone (6.5%, a difference of 0.14%), and Immigrants from Panama (6.5%, a difference of 0.17%).
| Demographics | Rating | Rank | Disability Age 18 to 34 |
| Bulgarians | 78.3 /100 | #152 | Good 6.5% |
| Immigrants | Eritrea | 77.4 /100 | #153 | Good 6.5% |
| Immigrants | Central America | 76.8 /100 | #154 | Good 6.5% |
| Inupiat | 76.7 /100 | #155 | Good 6.5% |
| Immigrants | Panama | 75.3 /100 | #156 | Good 6.5% |
| Immigrants | Sierra Leone | 75.0 /100 | #157 | Good 6.5% |
| Zimbabweans | 74.7 /100 | #158 | Good 6.5% |
| Dominicans | 73.6 /100 | #159 | Good 6.5% |
| Immigrants | Southern Europe | 72.5 /100 | #160 | Good 6.5% |
| Arabs | 72.3 /100 | #161 | Good 6.5% |
| South Africans | 71.7 /100 | #162 | Good 6.5% |
| Immigrants | Denmark | 71.7 /100 | #163 | Good 6.5% |
| Immigrants | Nigeria | 70.4 /100 | #164 | Good 6.5% |
| Immigrants | Hungary | 69.6 /100 | #165 | Good 6.5% |
| Eastern Europeans | 65.1 /100 | #166 | Good 6.5% |