Basque vs Guatemalan Disability Age 18 to 34

COMPARE

Basque
Race
Ancestry
AfghanAfricanAlaska NativeAlaskan AthabascanAlbanianAleutAlsatianAmericanApacheArabArapahoArgentineanArmenianAssyrian/Chaldean/SyriacAustralianAustrianBahamianBangladeshiBarbadianBasqueBelgianBelizeanBermudanBhutaneseBlackfeetBolivianBrazilianBritishBritish West IndianBulgarianBurmeseCajunCambodianCanadianCape VerdeanCarpatho RusynCelticCentral AmericanCentral American IndianCherokeeCheyenneChickasawChileanChineseChippewaChoctawColombianColvilleComancheCosta RicanCreeCreekCroatianCrowCubanCypriotCzechCzechoslovakianDanishDelawareDominicanDutchDutch West IndianEastern EuropeanEcuadorianEgyptianEnglishEstonianEthiopianEuropeanFijianFilipinoFinnishFrenchFrench American IndianFrench CanadianGermanGerman RussianGhanaianGreekGuamanian/ChamorroGuyaneseHaitianHmongHonduranHopiHoumaHungarianIcelanderIndian (Asian)IndonesianInupiatIranianIraqiIrishIroquoisIsraeliItalianJamaicanJapaneseJordanianKenyanKiowaKoreanLaotianLatvianLebaneseLiberianLithuanianLumbeeLuxembourgerMacedonianMalaysianMalteseMarshalleseMenomineeMexicanMexican American IndianMongolianMoroccanNative HawaiianNavajoNepaleseNew ZealanderNicaraguanNigerianNorthern EuropeanNorwegianOkinawanOsageOttawaPaiutePakistaniPalestinianPanamanianParaguayanPennsylvania GermanPeruvianPimaPolishPortuguesePotawatomiPuebloPuerto RicanPuget Sound SalishRomanianRussianSalvadoranSamoanScandinavianScotch-IrishScottishSeminoleSenegaleseSerbianShoshoneSierra LeoneanSiouxSlavicSlovakSloveneSomaliSouth AfricanSouth AmericanSouth American IndianSoviet UnionSpaniardSpanishSpanish AmericanSpanish American IndianSri LankanSubsaharan AfricanSudaneseSwedishSwissSyrianTaiwaneseThaiTlingit-HaidaTohono O'OdhamTonganTrinidadian and TobagonianTsimshianTurkishU.S. Virgin IslanderUgandanUkrainianUruguayanUteVenezuelanVietnameseWelshWest IndianYakamaYaquiYugoslavianYumanYup'ikZimbabwean
Immigration
NonimmigrantsImmigrantsAfghanistanAfricaAlbaniaArgentinaArmeniaAsiaAustraliaAustriaBahamasBangladeshBarbadosBelarusBelgiumBelizeBoliviaBosnia and HerzegovinaBrazilBulgariaBurma/MyanmarCabo VerdeCambodiaCameroonCanadaCaribbeanCentral AmericaChileChinaColombiaCongoCosta RicaCroatiaCubaCzechoslovakiaDenmarkDominicaDominican RepublicEastern AfricaEastern AsiaEastern EuropeEcuadorEgyptEl SalvadorEnglandEritreaEthiopiaEuropeFijiFranceGermanyGhanaGreeceGrenadaGuatemalaGuyanaHaitiHondurasHong KongHungaryIndiaIndonesiaIranIraqIrelandIsraelItalyJamaicaJapanJordanKazakhstanKenyaKoreaKuwaitLaosLatin AmericaLatviaLebanonLiberiaLithuaniaMalaysiaMexicoMicronesiaMiddle AfricaMoldovaMoroccoNepalNetherlandsNicaraguaNigeriaNorth AmericaNorth MacedoniaNorthern AfricaNorthern EuropeNorwayOceaniaPakistanPanamaPeruPhilippinesPolandPortugalRomaniaRussiaSaudi ArabiaScotlandSenegalSerbiaSierra LeoneSingaporeSomaliaSouth AfricaSouth AmericaSouth Central AsiaSouth Eastern AsiaSouthern EuropeSpainSri LankaSt. Vincent and the GrenadinesSudanSwedenSwitzerlandSyriaTaiwanThailandTrinidad and TobagoTurkeyUgandaUkraineUruguayUzbekistanVenezuelaVietnamWest IndiesWestern AfricaWestern AsiaWestern EuropeYemenZaireZimbabweAzores
Guatemalan
Race
Ancestry
AfghanAfricanAlaska NativeAlaskan AthabascanAlbanianAleutAlsatianAmericanApacheArabArapahoArgentineanArmenianAssyrian/Chaldean/SyriacAustralianAustrianBahamianBangladeshiBarbadianBelgianBelizeanBermudanBhutaneseBlackfeetBolivianBrazilianBritishBritish West IndianBulgarianBurmeseCajunCambodianCanadianCape VerdeanCarpatho RusynCelticCentral AmericanCentral American IndianCherokeeCheyenneChickasawChileanChineseChippewaChoctawColombianColvilleComancheCosta RicanCreeCreekCroatianCrowCubanCypriotCzechCzechoslovakianDanishDelawareDominicanDutchDutch West IndianEastern EuropeanEcuadorianEgyptianEnglishEstonianEthiopianEuropeanFijianFilipinoFinnishFrenchFrench American IndianFrench CanadianGermanGerman RussianGhanaianGreekGuamanian/ChamorroGuatemalanGuyaneseHaitianHmongHonduranHopiHoumaHungarianIcelanderIndian (Asian)IndonesianInupiatIranianIraqiIrishIroquoisIsraeliItalianJamaicanJapaneseJordanianKenyanKiowaKoreanLaotianLatvianLebaneseLiberianLithuanianLumbeeLuxembourgerMacedonianMalaysianMalteseMarshalleseMenomineeMexicanMexican American IndianMongolianMoroccanNative HawaiianNavajoNepaleseNew ZealanderNicaraguanNigerianNorthern EuropeanNorwegianOkinawanOsageOttawaPaiutePakistaniPalestinianPanamanianParaguayanPennsylvania GermanPeruvianPimaPolishPortuguesePotawatomiPuebloPuerto RicanPuget Sound SalishRomanianRussianSalvadoranSamoanScandinavianScotch-IrishScottishSeminoleSenegaleseSerbianShoshoneSierra LeoneanSiouxSlavicSlovakSloveneSomaliSouth AfricanSouth AmericanSouth American IndianSoviet UnionSpaniardSpanishSpanish AmericanSpanish American IndianSri LankanSubsaharan AfricanSudaneseSwedishSwissSyrianTaiwaneseThaiTlingit-HaidaTohono O'OdhamTonganTrinidadian and TobagonianTsimshianTurkishU.S. Virgin IslanderUgandanUkrainianUruguayanUteVenezuelanVietnameseWelshWest IndianYakamaYaquiYugoslavianYumanYup'ikZimbabwean
Immigration
NonimmigrantsImmigrantsAfghanistanAfricaAlbaniaArgentinaArmeniaAsiaAustraliaAustriaBahamasBangladeshBarbadosBelarusBelgiumBelizeBoliviaBosnia and HerzegovinaBrazilBulgariaBurma/MyanmarCabo VerdeCambodiaCameroonCanadaCaribbeanCentral AmericaChileChinaColombiaCongoCosta RicaCroatiaCubaCzechoslovakiaDenmarkDominicaDominican RepublicEastern AfricaEastern AsiaEastern EuropeEcuadorEgyptEl SalvadorEnglandEritreaEthiopiaEuropeFijiFranceGermanyGhanaGreeceGrenadaGuatemalaGuyanaHaitiHondurasHong KongHungaryIndiaIndonesiaIranIraqIrelandIsraelItalyJamaicaJapanJordanKazakhstanKenyaKoreaKuwaitLaosLatin AmericaLatviaLebanonLiberiaLithuaniaMalaysiaMexicoMicronesiaMiddle AfricaMoldovaMoroccoNepalNetherlandsNicaraguaNigeriaNorth AmericaNorth MacedoniaNorthern AfricaNorthern EuropeNorwayOceaniaPakistanPanamaPeruPhilippinesPolandPortugalRomaniaRussiaSaudi ArabiaScotlandSenegalSerbiaSierra LeoneSingaporeSomaliaSouth AfricaSouth AmericaSouth Central AsiaSouth Eastern AsiaSouthern EuropeSpainSri LankaSt. Vincent and the GrenadinesSudanSwedenSwitzerlandSyriaTaiwanThailandTrinidad and TobagoTurkeyUgandaUkraineUruguayUzbekistanVenezuelaVietnamWest IndiesWestern AfricaWestern AsiaWestern EuropeYemenZaireZimbabweAzores
Disability Age 18 to 34
Income
Poverty
Unemployment
Labor Participation
Family Structure
Vehicle Availability
Education Level
Disability

Disability Age 18 to 34 Comparison

Basques

Guatemalans

Tragic
Excellent
7.4%
DISABILITY AGE 18 TO 34
0.1/ 100
METRIC RATING
269th/ 347
METRIC RANK
6.4%
DISABILITY AGE 18 TO 34
89.6/ 100
METRIC RATING
132nd/ 347
METRIC RANK

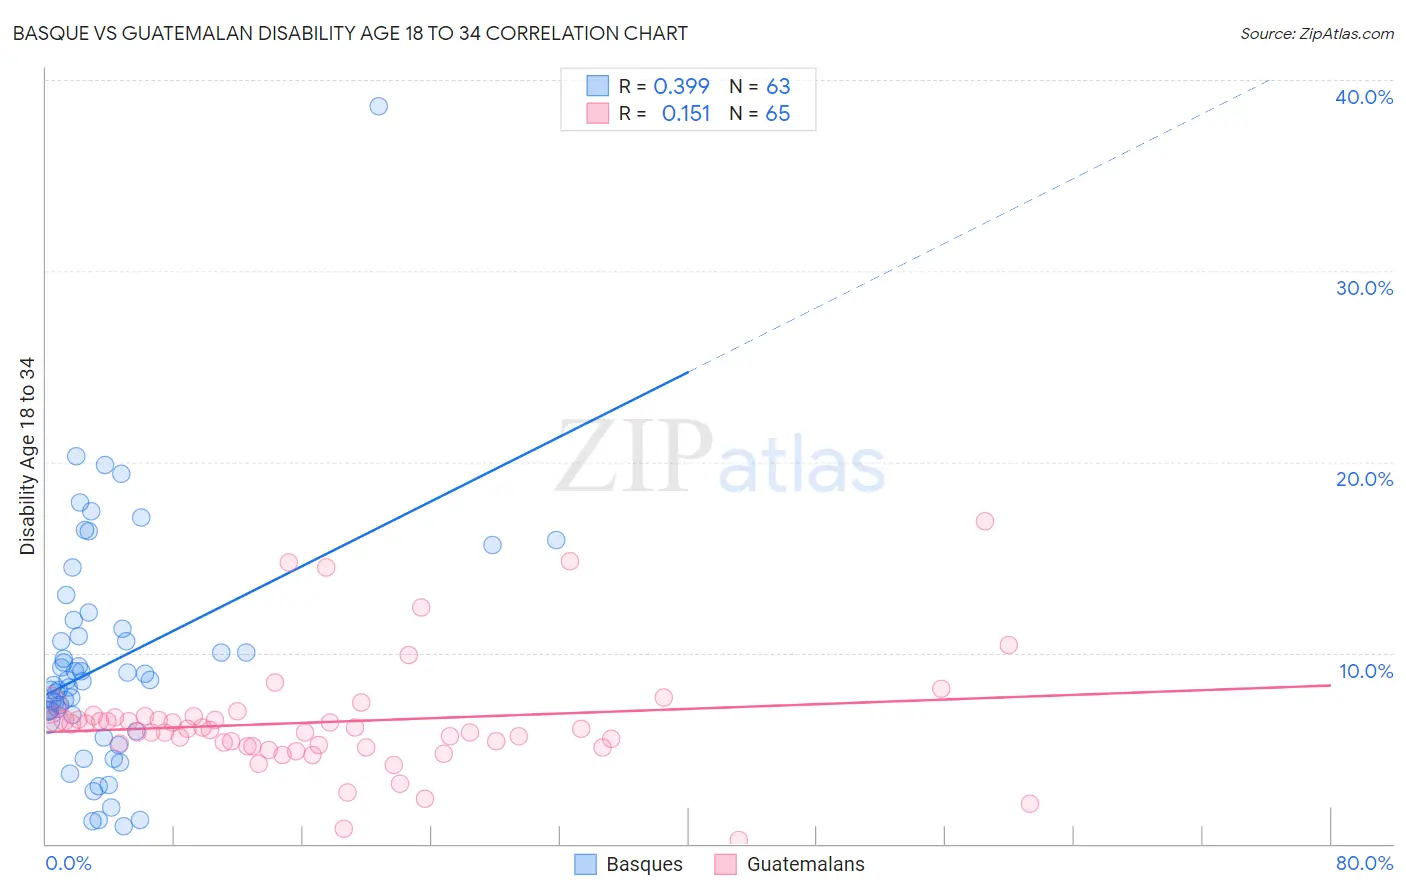
Basque vs Guatemalan Disability Age 18 to 34 Correlation Chart

The statistical analysis conducted on geographies consisting of 165,605,006 people shows a mild positive correlation between the proportion of Basques and percentage of population with a disability between the ages 18 and 35 in the United States with a correlation coefficient (R) of 0.399 and weighted average of 7.4%. Similarly, the statistical analysis conducted on geographies consisting of 408,778,912 people shows a poor positive correlation between the proportion of Guatemalans and percentage of population with a disability between the ages 18 and 35 in the United States with a correlation coefficient (R) of 0.151 and weighted average of 6.4%, a difference of 16.1%.
Basque vs Guatemalan Disability Age 18 to 34

Disability Age 18 to 34 Correlation Summary

MeasurementBasqueGuatemalan
Minimum0.88%0.22%
Maximum38.6%16.9%
Range37.7%16.7%
Mean9.5%6.4%
Median8.5%6.0%
Interquartile 25% (IQ1)6.5%5.1%
Interquartile 75% (IQ3)11.2%6.6%
Interquartile Range (IQR)4.8%1.6%
Standard Deviation (Sample)6.1%3.0%
Standard Deviation (Population)6.0%2.9%

Similar Demographics by Disability Age 18 to 34

Demographics Similar to Basques by Disability Age 18 to 34

In terms of disability age 18 to 34, the demographic groups most similar to Basques are Portuguese (7.4%, a difference of 0.040%), Belgian (7.4%, a difference of 0.090%), Bangladeshi (7.4%, a difference of 0.11%), Swiss (7.4%, a difference of 0.14%), and German Russian (7.4%, a difference of 0.18%).
DemographicsRating | RankDisability Age 18 to 34
Canadians
0.2
/100
|
#262
Tragic
7.3%
British
0.2
/100
|
#263
Tragic
7.3%
Bermudans
0.1
/100
|
#264
Tragic
7.3%
Slovenes
0.1
/100
|
#265
Tragic
7.3%
German Russians
0.1
/100
|
#266
Tragic
7.4%
Bangladeshis
0.1
/100
|
#267
Tragic
7.4%
Portuguese
0.1
/100
|
#268
Tragic
7.4%
Basques
0.1
/100
|
#269
Tragic
7.4%
Belgians
0.1
/100
|
#270
Tragic
7.4%
Swiss
0.1
/100
|
#271
Tragic
7.4%
Tsimshian
0.1
/100
|
#272
Tragic
7.4%
Slavs
0.1
/100
|
#273
Tragic
7.4%
Africans
0.1
/100
|
#274
Tragic
7.4%
Immigrants | Somalia
0.1
/100
|
#275
Tragic
7.4%
Europeans
0.1
/100
|
#276
Tragic
7.4%

Demographics Similar to Guatemalans by Disability Age 18 to 34

In terms of disability age 18 to 34, the demographic groups most similar to Guatemalans are Brazilian (6.4%, a difference of 0.12%), Immigrants from Europe (6.4%, a difference of 0.15%), Immigrants from Saudi Arabia (6.3%, a difference of 0.16%), Immigrants from Dominica (6.3%, a difference of 0.18%), and Immigrants from Italy (6.3%, a difference of 0.19%).
DemographicsRating | RankDisability Age 18 to 34
Macedonians
92.6
/100
|
#125
Exceptional
6.3%
Immigrants | Switzerland
92.5
/100
|
#126
Exceptional
6.3%
West Indians
92.0
/100
|
#127
Exceptional
6.3%
Chinese
91.9
/100
|
#128
Exceptional
6.3%
Immigrants | Italy
90.5
/100
|
#129
Exceptional
6.3%
Immigrants | Dominica
90.5
/100
|
#130
Exceptional
6.3%
Immigrants | Saudi Arabia
90.4
/100
|
#131
Exceptional
6.3%
Guatemalans
89.6
/100
|
#132
Excellent
6.4%
Brazilians
89.0
/100
|
#133
Excellent
6.4%
Immigrants | Europe
88.8
/100
|
#134
Excellent
6.4%
Palestinians
88.5
/100
|
#135
Excellent
6.4%
Immigrants | Sweden
88.5
/100
|
#136
Excellent
6.4%
Immigrants | Honduras
87.7
/100
|
#137
Excellent
6.4%
Spanish American Indians
87.7
/100
|
#138
Excellent
6.4%
Immigrants | Belize
87.4
/100
|
#139
Excellent
6.4%