Panamanian vs Dominican Disability Age 18 to 34
COMPARE
Panamanian
Dominican
Disability Age 18 to 34
Disability Age 18 to 34 Comparison
Panamanians
Dominicans
6.8%
DISABILITY AGE 18 TO 34
15.8/ 100
METRIC RATING
202nd/ 347
METRIC RANK
6.5%
DISABILITY AGE 18 TO 34
73.6/ 100
METRIC RATING
159th/ 347
METRIC RANK
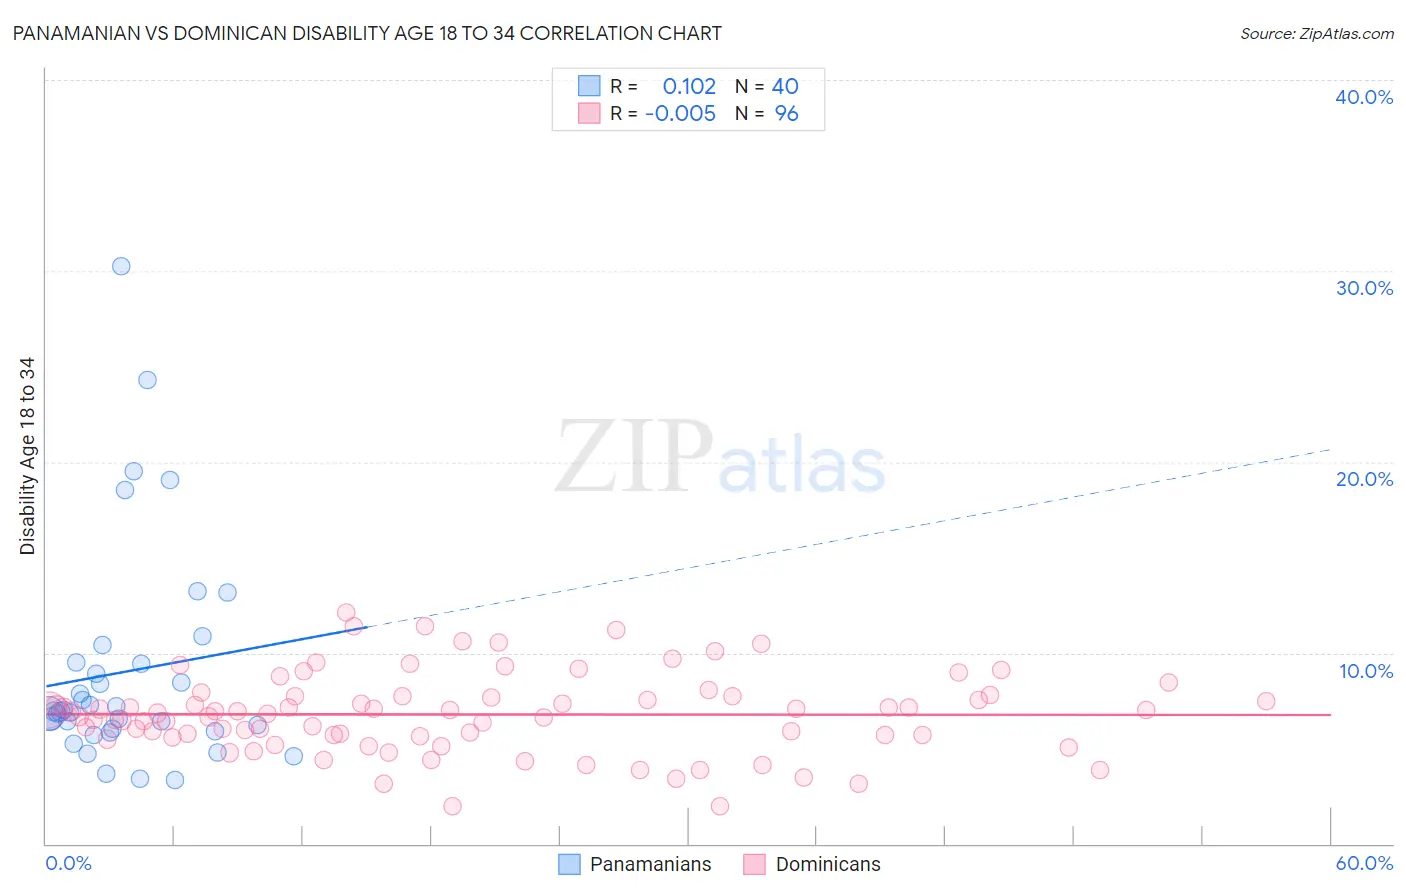
Panamanian vs Dominican Disability Age 18 to 34 Correlation Chart
The statistical analysis conducted on geographies consisting of 280,999,294 people shows a poor positive correlation between the proportion of Panamanians and percentage of population with a disability between the ages 18 and 35 in the United States with a correlation coefficient (R) of 0.102 and weighted average of 6.8%. Similarly, the statistical analysis conducted on geographies consisting of 354,342,196 people shows no correlation between the proportion of Dominicans and percentage of population with a disability between the ages 18 and 35 in the United States with a correlation coefficient (R) of -0.005 and weighted average of 6.5%, a difference of 4.8%.
Disability Age 18 to 34 Correlation Summary
| Measurement | Panamanian | Dominican |
| Minimum | 3.4% | 1.9% |
| Maximum | 30.3% | 12.1% |
| Range | 26.9% | 10.1% |
| Mean | 9.0% | 6.8% |
| Median | 6.9% | 6.8% |
| Interquartile 25% (IQ1) | 6.0% | 5.7% |
| Interquartile 75% (IQ3) | 9.4% | 7.7% |
| Interquartile Range (IQR) | 3.5% | 2.0% |
| Standard Deviation (Sample) | 5.8% | 2.1% |
| Standard Deviation (Population) | 5.7% | 2.1% |
Similar Demographics by Disability Age 18 to 34
Demographics Similar to Panamanians by Disability Age 18 to 34
In terms of disability age 18 to 34, the demographic groups most similar to Panamanians are Greek (6.8%, a difference of 0.040%), Sierra Leonean (6.8%, a difference of 0.21%), Hispanic or Latino (6.8%, a difference of 0.26%), Immigrants from Bosnia and Herzegovina (6.8%, a difference of 0.29%), and Kenyan (6.8%, a difference of 0.30%).
| Demographics | Rating | Rank | Disability Age 18 to 34 |
| Mexican American Indians | 22.3 /100 | #195 | Fair 6.7% |
| Immigrants | Netherlands | 21.0 /100 | #196 | Fair 6.7% |
| Estonians | 20.6 /100 | #197 | Fair 6.8% |
| Australians | 19.4 /100 | #198 | Poor 6.8% |
| Kenyans | 18.3 /100 | #199 | Poor 6.8% |
| Sierra Leoneans | 17.5 /100 | #200 | Poor 6.8% |
| Greeks | 16.1 /100 | #201 | Poor 6.8% |
| Panamanians | 15.8 /100 | #202 | Poor 6.8% |
| Hispanics or Latinos | 13.8 /100 | #203 | Poor 6.8% |
| Immigrants | Bosnia and Herzegovina | 13.6 /100 | #204 | Poor 6.8% |
| Lebanese | 13.3 /100 | #205 | Poor 6.8% |
| Japanese | 12.8 /100 | #206 | Poor 6.8% |
| Mexicans | 12.6 /100 | #207 | Poor 6.8% |
| Immigrants | Scotland | 12.4 /100 | #208 | Poor 6.8% |
| Immigrants | Burma/Myanmar | 12.3 /100 | #209 | Poor 6.8% |
Demographics Similar to Dominicans by Disability Age 18 to 34
In terms of disability age 18 to 34, the demographic groups most similar to Dominicans are Immigrants from Southern Europe (6.5%, a difference of 0.090%), Zimbabwean (6.5%, a difference of 0.11%), Arab (6.5%, a difference of 0.11%), Immigrants from Sierra Leone (6.5%, a difference of 0.14%), and Immigrants from Panama (6.5%, a difference of 0.17%).
| Demographics | Rating | Rank | Disability Age 18 to 34 |
| Bulgarians | 78.3 /100 | #152 | Good 6.5% |
| Immigrants | Eritrea | 77.4 /100 | #153 | Good 6.5% |
| Immigrants | Central America | 76.8 /100 | #154 | Good 6.5% |
| Inupiat | 76.7 /100 | #155 | Good 6.5% |
| Immigrants | Panama | 75.3 /100 | #156 | Good 6.5% |
| Immigrants | Sierra Leone | 75.0 /100 | #157 | Good 6.5% |
| Zimbabweans | 74.7 /100 | #158 | Good 6.5% |
| Dominicans | 73.6 /100 | #159 | Good 6.5% |
| Immigrants | Southern Europe | 72.5 /100 | #160 | Good 6.5% |
| Arabs | 72.3 /100 | #161 | Good 6.5% |
| South Africans | 71.7 /100 | #162 | Good 6.5% |
| Immigrants | Denmark | 71.7 /100 | #163 | Good 6.5% |
| Immigrants | Nigeria | 70.4 /100 | #164 | Good 6.5% |
| Immigrants | Hungary | 69.6 /100 | #165 | Good 6.5% |
| Eastern Europeans | 65.1 /100 | #166 | Good 6.5% |