Immigrants from Israel vs Dominican Disability Age 18 to 34
COMPARE
Immigrants from Israel
Dominican
Disability Age 18 to 34
Disability Age 18 to 34 Comparison
Immigrants from Israel
Dominicans
5.6%
DISABILITY AGE 18 TO 34
100.0/ 100
METRIC RATING
16th/ 347
METRIC RANK
6.5%
DISABILITY AGE 18 TO 34
73.6/ 100
METRIC RATING
159th/ 347
METRIC RANK
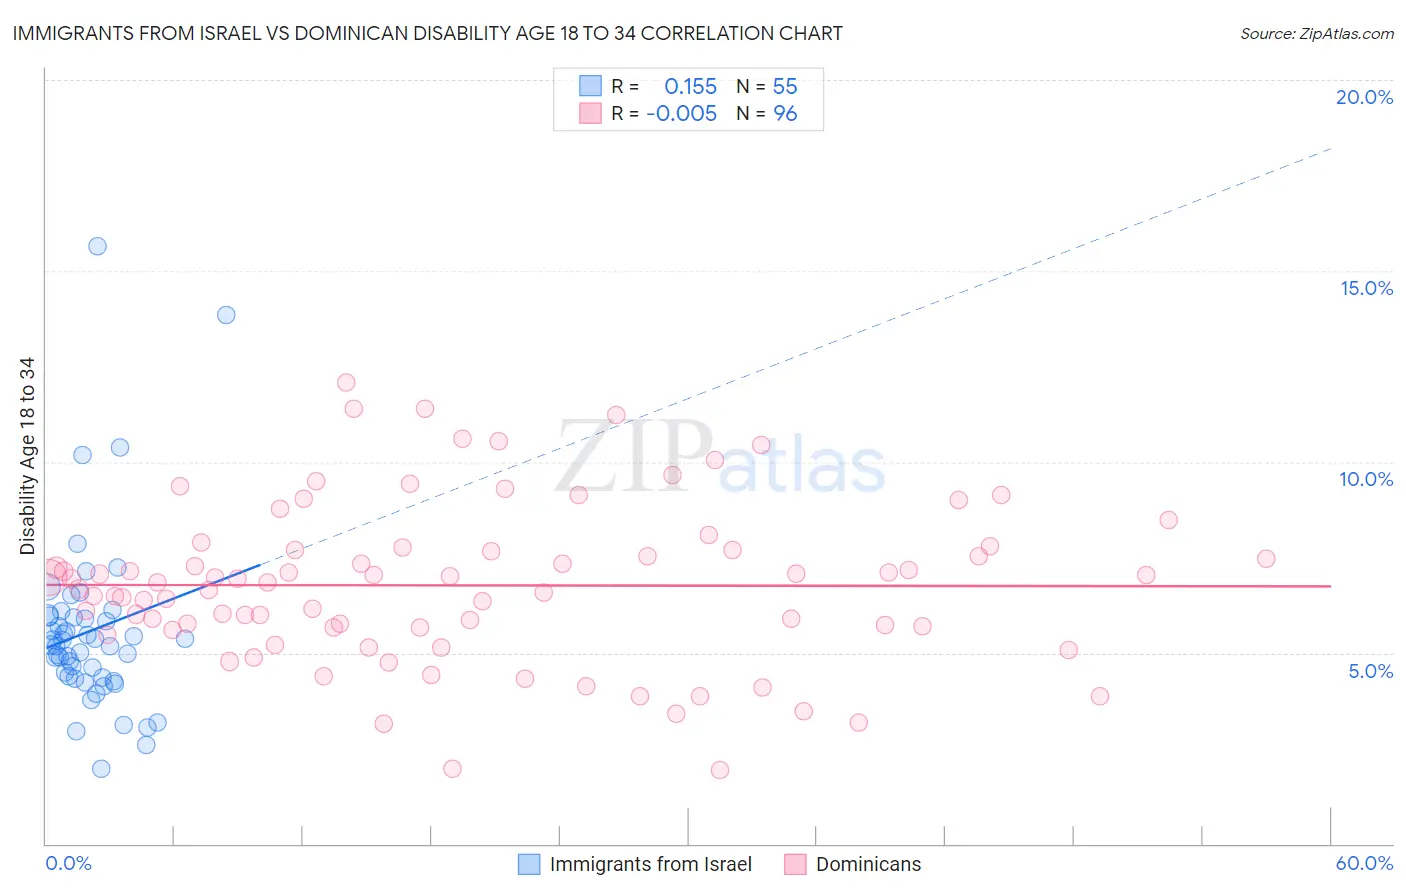
Immigrants from Israel vs Dominican Disability Age 18 to 34 Correlation Chart
The statistical analysis conducted on geographies consisting of 209,753,072 people shows a poor positive correlation between the proportion of Immigrants from Israel and percentage of population with a disability between the ages 18 and 35 in the United States with a correlation coefficient (R) of 0.155 and weighted average of 5.6%. Similarly, the statistical analysis conducted on geographies consisting of 354,342,196 people shows no correlation between the proportion of Dominicans and percentage of population with a disability between the ages 18 and 35 in the United States with a correlation coefficient (R) of -0.005 and weighted average of 6.5%, a difference of 16.3%.
Disability Age 18 to 34 Correlation Summary
| Measurement | Immigrants from Israel | Dominican |
| Minimum | 2.0% | 1.9% |
| Maximum | 15.6% | 12.1% |
| Range | 13.7% | 10.1% |
| Mean | 5.6% | 6.8% |
| Median | 5.2% | 6.8% |
| Interquartile 25% (IQ1) | 4.3% | 5.7% |
| Interquartile 75% (IQ3) | 5.9% | 7.7% |
| Interquartile Range (IQR) | 1.6% | 2.0% |
| Standard Deviation (Sample) | 2.4% | 2.1% |
| Standard Deviation (Population) | 2.3% | 2.1% |
Similar Demographics by Disability Age 18 to 34
Demographics Similar to Immigrants from Israel by Disability Age 18 to 34
In terms of disability age 18 to 34, the demographic groups most similar to Immigrants from Israel are Immigrants from India (5.6%, a difference of 0.030%), Immigrants from Eastern Asia (5.6%, a difference of 0.17%), Indian (Asian) (5.5%, a difference of 0.41%), Immigrants from Iran (5.5%, a difference of 0.56%), and Immigrants from St. Vincent and the Grenadines (5.5%, a difference of 0.88%).
| Demographics | Rating | Rank | Disability Age 18 to 34 |
| Guyanese | 100.0 /100 | #9 | Exceptional 5.5% |
| Immigrants | Uzbekistan | 100.0 /100 | #10 | Exceptional 5.5% |
| Vietnamese | 100.0 /100 | #11 | Exceptional 5.5% |
| Immigrants | St. Vincent and the Grenadines | 100.0 /100 | #12 | Exceptional 5.5% |
| Immigrants | Iran | 100.0 /100 | #13 | Exceptional 5.5% |
| Indians (Asian) | 100.0 /100 | #14 | Exceptional 5.5% |
| Immigrants | India | 100.0 /100 | #15 | Exceptional 5.6% |
| Immigrants | Israel | 100.0 /100 | #16 | Exceptional 5.6% |
| Immigrants | Eastern Asia | 100.0 /100 | #17 | Exceptional 5.6% |
| Immigrants | Bolivia | 100.0 /100 | #18 | Exceptional 5.6% |
| Thais | 100.0 /100 | #19 | Exceptional 5.6% |
| Immigrants | Bangladesh | 100.0 /100 | #20 | Exceptional 5.6% |
| Immigrants | South Central Asia | 100.0 /100 | #21 | Exceptional 5.7% |
| Immigrants | Nicaragua | 100.0 /100 | #22 | Exceptional 5.7% |
| Cubans | 100.0 /100 | #23 | Exceptional 5.7% |
Demographics Similar to Dominicans by Disability Age 18 to 34
In terms of disability age 18 to 34, the demographic groups most similar to Dominicans are Immigrants from Southern Europe (6.5%, a difference of 0.090%), Zimbabwean (6.5%, a difference of 0.11%), Arab (6.5%, a difference of 0.11%), Immigrants from Sierra Leone (6.5%, a difference of 0.14%), and Immigrants from Panama (6.5%, a difference of 0.17%).
| Demographics | Rating | Rank | Disability Age 18 to 34 |
| Bulgarians | 78.3 /100 | #152 | Good 6.5% |
| Immigrants | Eritrea | 77.4 /100 | #153 | Good 6.5% |
| Immigrants | Central America | 76.8 /100 | #154 | Good 6.5% |
| Inupiat | 76.7 /100 | #155 | Good 6.5% |
| Immigrants | Panama | 75.3 /100 | #156 | Good 6.5% |
| Immigrants | Sierra Leone | 75.0 /100 | #157 | Good 6.5% |
| Zimbabweans | 74.7 /100 | #158 | Good 6.5% |
| Dominicans | 73.6 /100 | #159 | Good 6.5% |
| Immigrants | Southern Europe | 72.5 /100 | #160 | Good 6.5% |
| Arabs | 72.3 /100 | #161 | Good 6.5% |
| South Africans | 71.7 /100 | #162 | Good 6.5% |
| Immigrants | Denmark | 71.7 /100 | #163 | Good 6.5% |
| Immigrants | Nigeria | 70.4 /100 | #164 | Good 6.5% |
| Immigrants | Hungary | 69.6 /100 | #165 | Good 6.5% |
| Eastern Europeans | 65.1 /100 | #166 | Good 6.5% |