Barbadian vs Swedish Householder Income Over 65 years
COMPARE
Barbadian
Swedish
Householder Income Over 65 years
Householder Income Over 65 years Comparison
Barbadians
Swedes
$54,163
HOUSEHOLDER INCOME OVER 65 YEARS
0.1/ 100
METRIC RATING
274th/ 347
METRIC RANK
$62,736
HOUSEHOLDER INCOME OVER 65 YEARS
86.4/ 100
METRIC RATING
127th/ 347
METRIC RANK
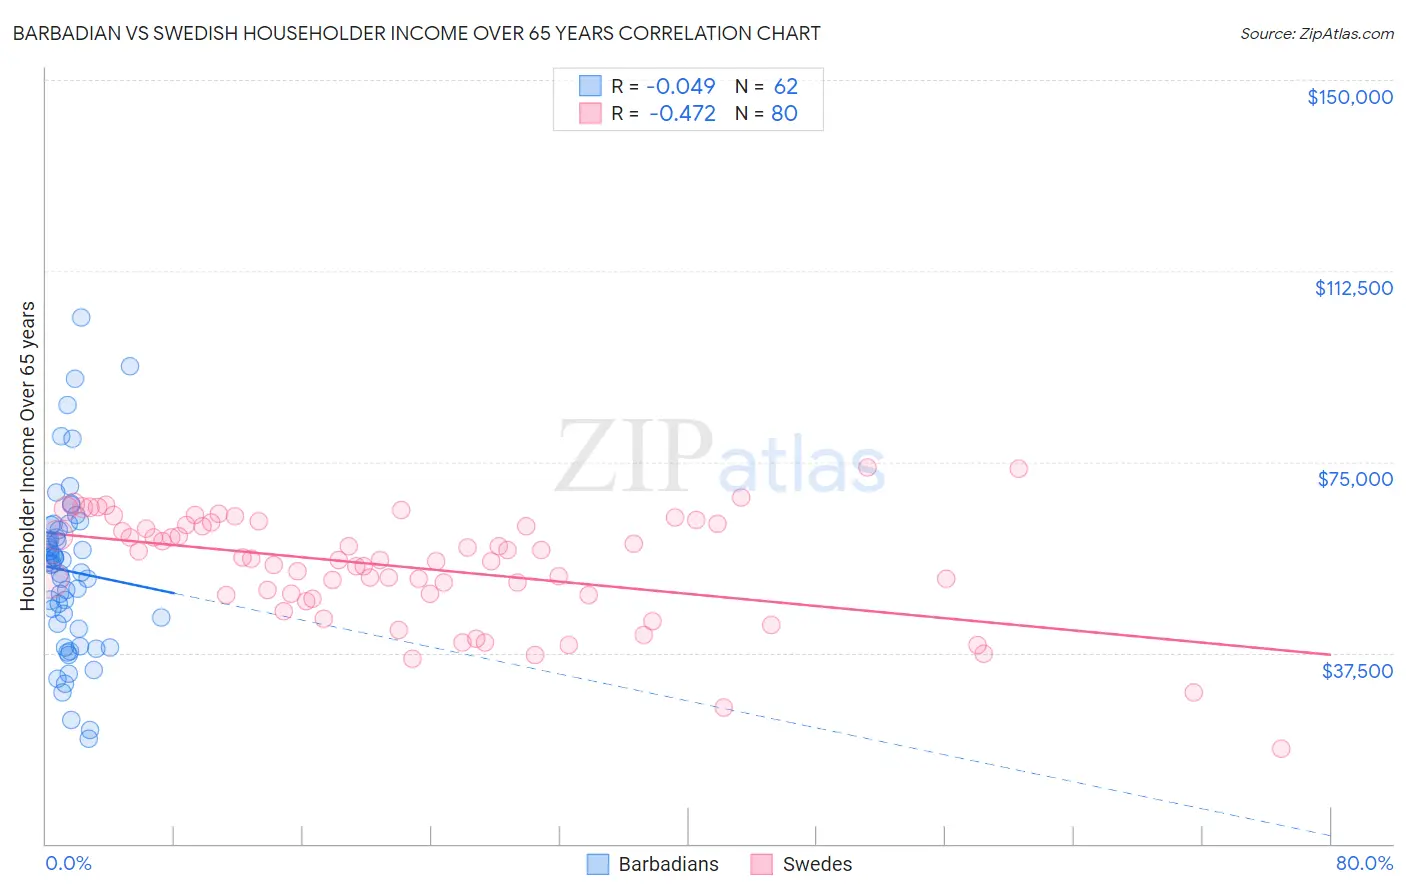
Barbadian vs Swedish Householder Income Over 65 years Correlation Chart
The statistical analysis conducted on geographies consisting of 141,115,722 people shows no correlation between the proportion of Barbadians and household income with householder over the age of 65 in the United States with a correlation coefficient (R) of -0.049 and weighted average of $54,163. Similarly, the statistical analysis conducted on geographies consisting of 535,443,015 people shows a moderate negative correlation between the proportion of Swedes and household income with householder over the age of 65 in the United States with a correlation coefficient (R) of -0.472 and weighted average of $62,736, a difference of 15.8%.
Householder Income Over 65 years Correlation Summary
| Measurement | Barbadian | Swedish |
| Minimum | $20,697 | $18,625 |
| Maximum | $103,317 | $73,958 |
| Range | $82,620 | $55,333 |
| Mean | $53,555 | $54,196 |
| Median | $54,900 | $55,741 |
| Interquartile 25% (IQ1) | $42,188 | $48,778 |
| Interquartile 75% (IQ3) | $61,698 | $62,473 |
| Interquartile Range (IQR) | $19,510 | $13,695 |
| Standard Deviation (Sample) | $16,744 | $10,707 |
| Standard Deviation (Population) | $16,609 | $10,640 |
Similar Demographics by Householder Income Over 65 years
Demographics Similar to Barbadians by Householder Income Over 65 years
In terms of householder income over 65 years, the demographic groups most similar to Barbadians are Indonesian ($54,176, a difference of 0.020%), Cherokee ($54,133, a difference of 0.060%), Cree ($54,129, a difference of 0.060%), Potawatomi ($54,212, a difference of 0.090%), and Cheyenne ($54,096, a difference of 0.12%).
| Demographics | Rating | Rank | Householder Income Over 65 years |
| Guatemalans | 0.1 /100 | #267 | Tragic $54,526 |
| Immigrants | Zaire | 0.1 /100 | #268 | Tragic $54,512 |
| Nicaraguans | 0.1 /100 | #269 | Tragic $54,474 |
| Immigrants | Senegal | 0.1 /100 | #270 | Tragic $54,447 |
| Liberians | 0.1 /100 | #271 | Tragic $54,356 |
| Potawatomi | 0.1 /100 | #272 | Tragic $54,212 |
| Indonesians | 0.1 /100 | #273 | Tragic $54,176 |
| Barbadians | 0.1 /100 | #274 | Tragic $54,163 |
| Cherokee | 0.1 /100 | #275 | Tragic $54,133 |
| Cree | 0.1 /100 | #276 | Tragic $54,129 |
| Cheyenne | 0.1 /100 | #277 | Tragic $54,096 |
| Immigrants | Ecuador | 0.1 /100 | #278 | Tragic $54,030 |
| Blackfeet | 0.1 /100 | #279 | Tragic $54,029 |
| Immigrants | Jamaica | 0.1 /100 | #280 | Tragic $54,027 |
| Somalis | 0.1 /100 | #281 | Tragic $54,004 |
Demographics Similar to Swedes by Householder Income Over 65 years
In terms of householder income over 65 years, the demographic groups most similar to Swedes are Aleut ($62,708, a difference of 0.040%), Peruvian ($62,766, a difference of 0.050%), Immigrants from Eastern Europe ($62,693, a difference of 0.070%), Basque ($62,653, a difference of 0.13%), and Immigrants from Western Asia ($62,645, a difference of 0.15%).
| Demographics | Rating | Rank | Householder Income Over 65 years |
| Ukrainians | 89.7 /100 | #120 | Excellent $63,032 |
| Immigrants | Vietnam | 89.5 /100 | #121 | Excellent $63,014 |
| Immigrants | Moldova | 88.7 /100 | #122 | Excellent $62,939 |
| Tlingit-Haida | 88.6 /100 | #123 | Excellent $62,922 |
| Taiwanese | 88.3 /100 | #124 | Excellent $62,894 |
| Soviet Union | 87.8 /100 | #125 | Excellent $62,848 |
| Peruvians | 86.8 /100 | #126 | Excellent $62,766 |
| Swedes | 86.4 /100 | #127 | Excellent $62,736 |
| Aleuts | 86.1 /100 | #128 | Excellent $62,708 |
| Immigrants | Eastern Europe | 85.9 /100 | #129 | Excellent $62,693 |
| Basques | 85.4 /100 | #130 | Excellent $62,653 |
| Immigrants | Western Asia | 85.3 /100 | #131 | Excellent $62,645 |
| Immigrants | Germany | 83.9 /100 | #132 | Excellent $62,544 |
| Immigrants | Northern Africa | 83.6 /100 | #133 | Excellent $62,522 |
| Immigrants | Brazil | 81.2 /100 | #134 | Excellent $62,364 |