Bangladeshi vs Immigrants from Croatia Disability Age 18 to 34
COMPARE
Bangladeshi
Immigrants from Croatia
Disability Age 18 to 34
Disability Age 18 to 34 Comparison
Bangladeshis
Immigrants from Croatia
7.4%
DISABILITY AGE 18 TO 34
0.1/ 100
METRIC RATING
267th/ 347
METRIC RANK
6.2%
DISABILITY AGE 18 TO 34
95.7/ 100
METRIC RATING
108th/ 347
METRIC RANK
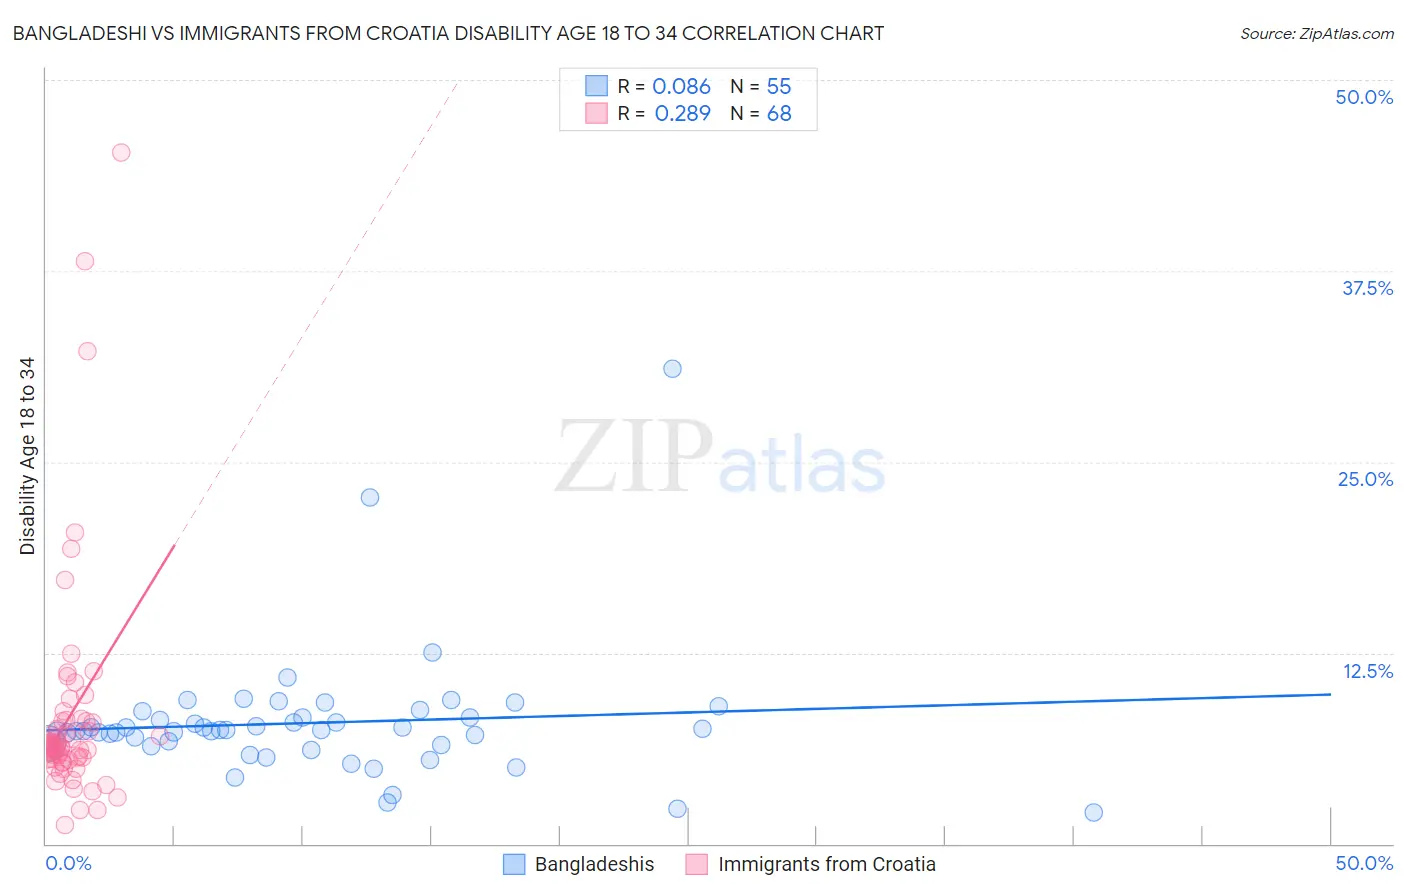
Bangladeshi vs Immigrants from Croatia Disability Age 18 to 34 Correlation Chart
The statistical analysis conducted on geographies consisting of 141,298,809 people shows a slight positive correlation between the proportion of Bangladeshis and percentage of population with a disability between the ages 18 and 35 in the United States with a correlation coefficient (R) of 0.086 and weighted average of 7.4%. Similarly, the statistical analysis conducted on geographies consisting of 132,448,335 people shows a weak positive correlation between the proportion of Immigrants from Croatia and percentage of population with a disability between the ages 18 and 35 in the United States with a correlation coefficient (R) of 0.289 and weighted average of 6.2%, a difference of 17.9%.
Disability Age 18 to 34 Correlation Summary
| Measurement | Bangladeshi | Immigrants from Croatia |
| Minimum | 2.0% | 1.3% |
| Maximum | 31.1% | 45.2% |
| Range | 29.1% | 44.0% |
| Mean | 7.9% | 8.4% |
| Median | 7.5% | 6.3% |
| Interquartile 25% (IQ1) | 6.4% | 5.6% |
| Interquartile 75% (IQ3) | 8.3% | 8.1% |
| Interquartile Range (IQR) | 1.9% | 2.4% |
| Standard Deviation (Sample) | 4.3% | 7.4% |
| Standard Deviation (Population) | 4.2% | 7.4% |
Similar Demographics by Disability Age 18 to 34
Demographics Similar to Bangladeshis by Disability Age 18 to 34
In terms of disability age 18 to 34, the demographic groups most similar to Bangladeshis are German Russian (7.4%, a difference of 0.060%), Portuguese (7.4%, a difference of 0.080%), Basque (7.4%, a difference of 0.11%), Belgian (7.4%, a difference of 0.21%), and Slovene (7.3%, a difference of 0.23%).
| Demographics | Rating | Rank | Disability Age 18 to 34 |
| Tohono O'odham | 0.2 /100 | #260 | Tragic 7.3% |
| Northern Europeans | 0.2 /100 | #261 | Tragic 7.3% |
| Canadians | 0.2 /100 | #262 | Tragic 7.3% |
| British | 0.2 /100 | #263 | Tragic 7.3% |
| Bermudans | 0.1 /100 | #264 | Tragic 7.3% |
| Slovenes | 0.1 /100 | #265 | Tragic 7.3% |
| German Russians | 0.1 /100 | #266 | Tragic 7.4% |
| Bangladeshis | 0.1 /100 | #267 | Tragic 7.4% |
| Portuguese | 0.1 /100 | #268 | Tragic 7.4% |
| Basques | 0.1 /100 | #269 | Tragic 7.4% |
| Belgians | 0.1 /100 | #270 | Tragic 7.4% |
| Swiss | 0.1 /100 | #271 | Tragic 7.4% |
| Tsimshian | 0.1 /100 | #272 | Tragic 7.4% |
| Slavs | 0.1 /100 | #273 | Tragic 7.4% |
| Africans | 0.1 /100 | #274 | Tragic 7.4% |
Demographics Similar to Immigrants from Croatia by Disability Age 18 to 34
In terms of disability age 18 to 34, the demographic groups most similar to Immigrants from Croatia are Ethiopian (6.2%, a difference of 0.040%), Sri Lankan (6.2%, a difference of 0.060%), Immigrants from Afghanistan (6.2%, a difference of 0.090%), Immigrants from Brazil (6.3%, a difference of 0.21%), and Immigrants from France (6.3%, a difference of 0.22%).
| Demographics | Rating | Rank | Disability Age 18 to 34 |
| Immigrants | Jamaica | 96.4 /100 | #101 | Exceptional 6.2% |
| Laotians | 96.4 /100 | #102 | Exceptional 6.2% |
| Immigrants | Bulgaria | 96.3 /100 | #103 | Exceptional 6.2% |
| Mongolians | 96.2 /100 | #104 | Exceptional 6.2% |
| Bhutanese | 96.2 /100 | #105 | Exceptional 6.2% |
| Immigrants | Afghanistan | 95.9 /100 | #106 | Exceptional 6.2% |
| Ethiopians | 95.8 /100 | #107 | Exceptional 6.2% |
| Immigrants | Croatia | 95.7 /100 | #108 | Exceptional 6.2% |
| Sri Lankans | 95.5 /100 | #109 | Exceptional 6.2% |
| Immigrants | Brazil | 95.2 /100 | #110 | Exceptional 6.3% |
| Immigrants | France | 95.1 /100 | #111 | Exceptional 6.3% |
| Immigrants | Romania | 94.9 /100 | #112 | Exceptional 6.3% |
| Immigrants | Latin America | 94.9 /100 | #113 | Exceptional 6.3% |
| Immigrants | South Eastern Asia | 94.4 /100 | #114 | Exceptional 6.3% |
| Koreans | 94.1 /100 | #115 | Exceptional 6.3% |