Bangladeshi vs Mongolian Cognitive Disability
COMPARE
Bangladeshi
Mongolian
Cognitive Disability
Cognitive Disability Comparison
Bangladeshis
Mongolians
18.6%
COGNITIVE DISABILITY
0.0/ 100
METRIC RATING
318th/ 347
METRIC RANK
17.7%
COGNITIVE DISABILITY
2.2/ 100
METRIC RATING
230th/ 347
METRIC RANK
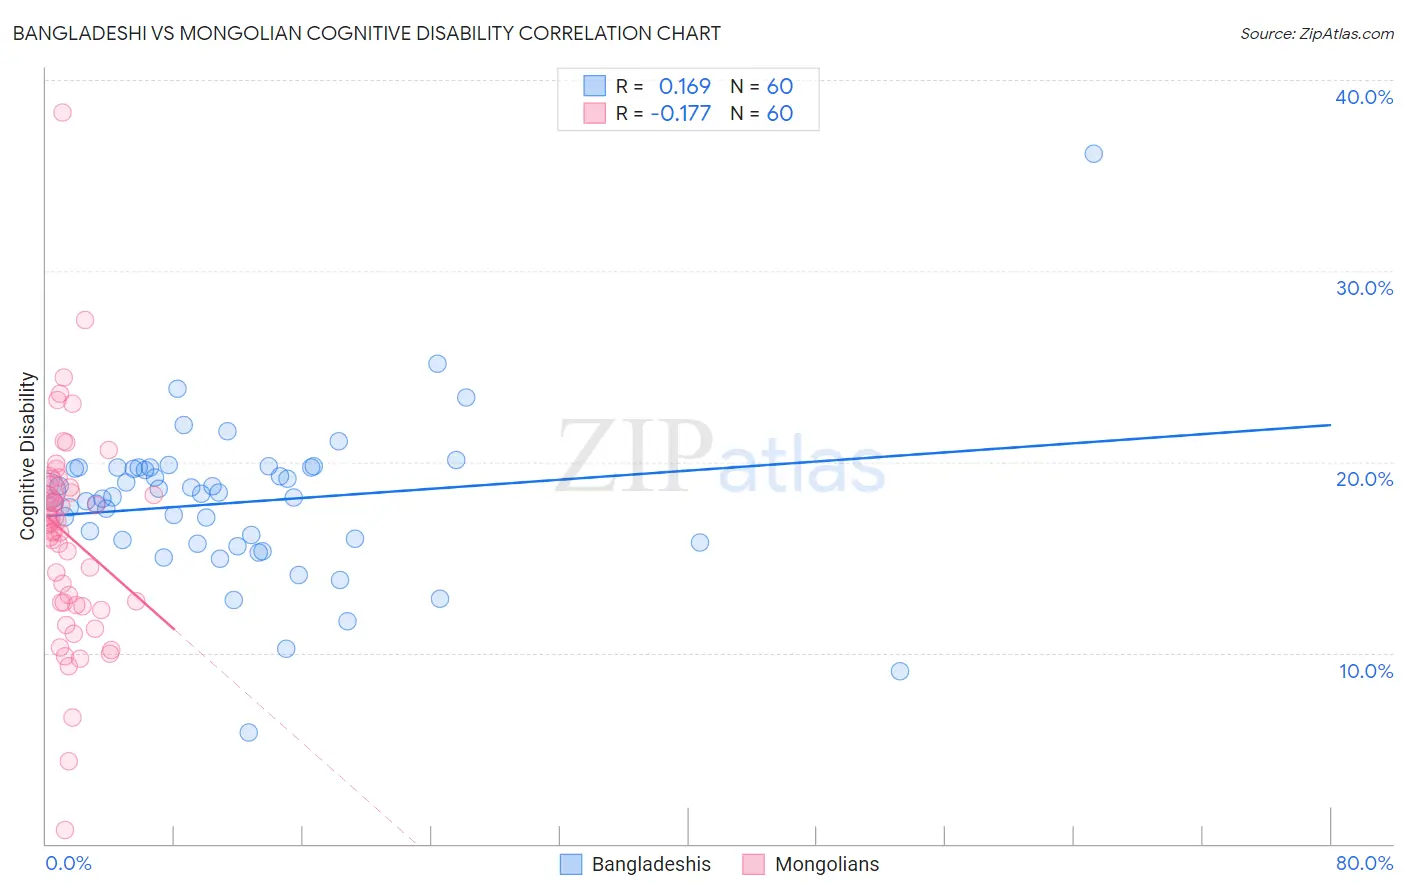
Bangladeshi vs Mongolian Cognitive Disability Correlation Chart
The statistical analysis conducted on geographies consisting of 141,390,027 people shows a poor positive correlation between the proportion of Bangladeshis and percentage of population with cognitive disability in the United States with a correlation coefficient (R) of 0.169 and weighted average of 18.6%. Similarly, the statistical analysis conducted on geographies consisting of 140,359,372 people shows a poor negative correlation between the proportion of Mongolians and percentage of population with cognitive disability in the United States with a correlation coefficient (R) of -0.177 and weighted average of 17.7%, a difference of 4.9%.
Cognitive Disability Correlation Summary
| Measurement | Bangladeshi | Mongolian |
| Minimum | 5.8% | 0.74% |
| Maximum | 36.1% | 38.3% |
| Range | 30.3% | 37.6% |
| Mean | 17.9% | 16.1% |
| Median | 18.3% | 16.8% |
| Interquartile 25% (IQ1) | 15.9% | 12.6% |
| Interquartile 75% (IQ3) | 19.7% | 18.7% |
| Interquartile Range (IQR) | 3.8% | 6.1% |
| Standard Deviation (Sample) | 4.1% | 5.7% |
| Standard Deviation (Population) | 4.1% | 5.6% |
Similar Demographics by Cognitive Disability
Demographics Similar to Bangladeshis by Cognitive Disability
In terms of cognitive disability, the demographic groups most similar to Bangladeshis are Comanche (18.6%, a difference of 0.040%), Apache (18.6%, a difference of 0.080%), Liberian (18.6%, a difference of 0.12%), African (18.6%, a difference of 0.17%), and Immigrants from Middle Africa (18.6%, a difference of 0.20%).
| Demographics | Rating | Rank | Cognitive Disability |
| Hmong | 0.0 /100 | #311 | Tragic 18.4% |
| Chickasaw | 0.0 /100 | #312 | Tragic 18.5% |
| Yaqui | 0.0 /100 | #313 | Tragic 18.5% |
| Sub-Saharan Africans | 0.0 /100 | #314 | Tragic 18.5% |
| Immigrants | Dominica | 0.0 /100 | #315 | Tragic 18.6% |
| Immigrants | Middle Africa | 0.0 /100 | #316 | Tragic 18.6% |
| Liberians | 0.0 /100 | #317 | Tragic 18.6% |
| Bangladeshis | 0.0 /100 | #318 | Tragic 18.6% |
| Comanche | 0.0 /100 | #319 | Tragic 18.6% |
| Apache | 0.0 /100 | #320 | Tragic 18.6% |
| Africans | 0.0 /100 | #321 | Tragic 18.6% |
| Immigrants | Liberia | 0.0 /100 | #322 | Tragic 18.7% |
| Pueblo | 0.0 /100 | #323 | Tragic 18.7% |
| Dominicans | 0.0 /100 | #324 | Tragic 18.7% |
| Indonesians | 0.0 /100 | #325 | Tragic 18.7% |
Demographics Similar to Mongolians by Cognitive Disability
In terms of cognitive disability, the demographic groups most similar to Mongolians are Immigrants from Guatemala (17.7%, a difference of 0.020%), Guatemalan (17.8%, a difference of 0.030%), Tongan (17.8%, a difference of 0.030%), Panamanian (17.8%, a difference of 0.040%), and Immigrants from Central America (17.7%, a difference of 0.050%).
| Demographics | Rating | Rank | Cognitive Disability |
| Alsatians | 4.5 /100 | #223 | Tragic 17.7% |
| Fijians | 3.4 /100 | #224 | Tragic 17.7% |
| Vietnamese | 3.4 /100 | #225 | Tragic 17.7% |
| Marshallese | 2.7 /100 | #226 | Tragic 17.7% |
| Immigrants | St. Vincent and the Grenadines | 2.6 /100 | #227 | Tragic 17.7% |
| Immigrants | Central America | 2.3 /100 | #228 | Tragic 17.7% |
| Immigrants | Guatemala | 2.2 /100 | #229 | Tragic 17.7% |
| Mongolians | 2.2 /100 | #230 | Tragic 17.7% |
| Guatemalans | 2.1 /100 | #231 | Tragic 17.8% |
| Tongans | 2.1 /100 | #232 | Tragic 17.8% |
| Panamanians | 2.1 /100 | #233 | Tragic 17.8% |
| Osage | 2.0 /100 | #234 | Tragic 17.8% |
| Spanish American Indians | 2.0 /100 | #235 | Tragic 17.8% |
| Immigrants | Iraq | 1.8 /100 | #236 | Tragic 17.8% |
| Immigrants | Mexico | 1.8 /100 | #237 | Tragic 17.8% |