Immigrants from Colombia vs Immigrants from Lithuania Disability Age 65 to 74
COMPARE
Immigrants from Colombia
Immigrants from Lithuania
Disability Age 65 to 74
Disability Age 65 to 74 Comparison
Immigrants from Colombia
Immigrants from Lithuania
22.2%
DISABILITY AGE 65 TO 74
96.8/ 100
METRIC RATING
99th/ 347
METRIC RANK
20.5%
DISABILITY AGE 65 TO 74
100.0/ 100
METRIC RATING
16th/ 347
METRIC RANK
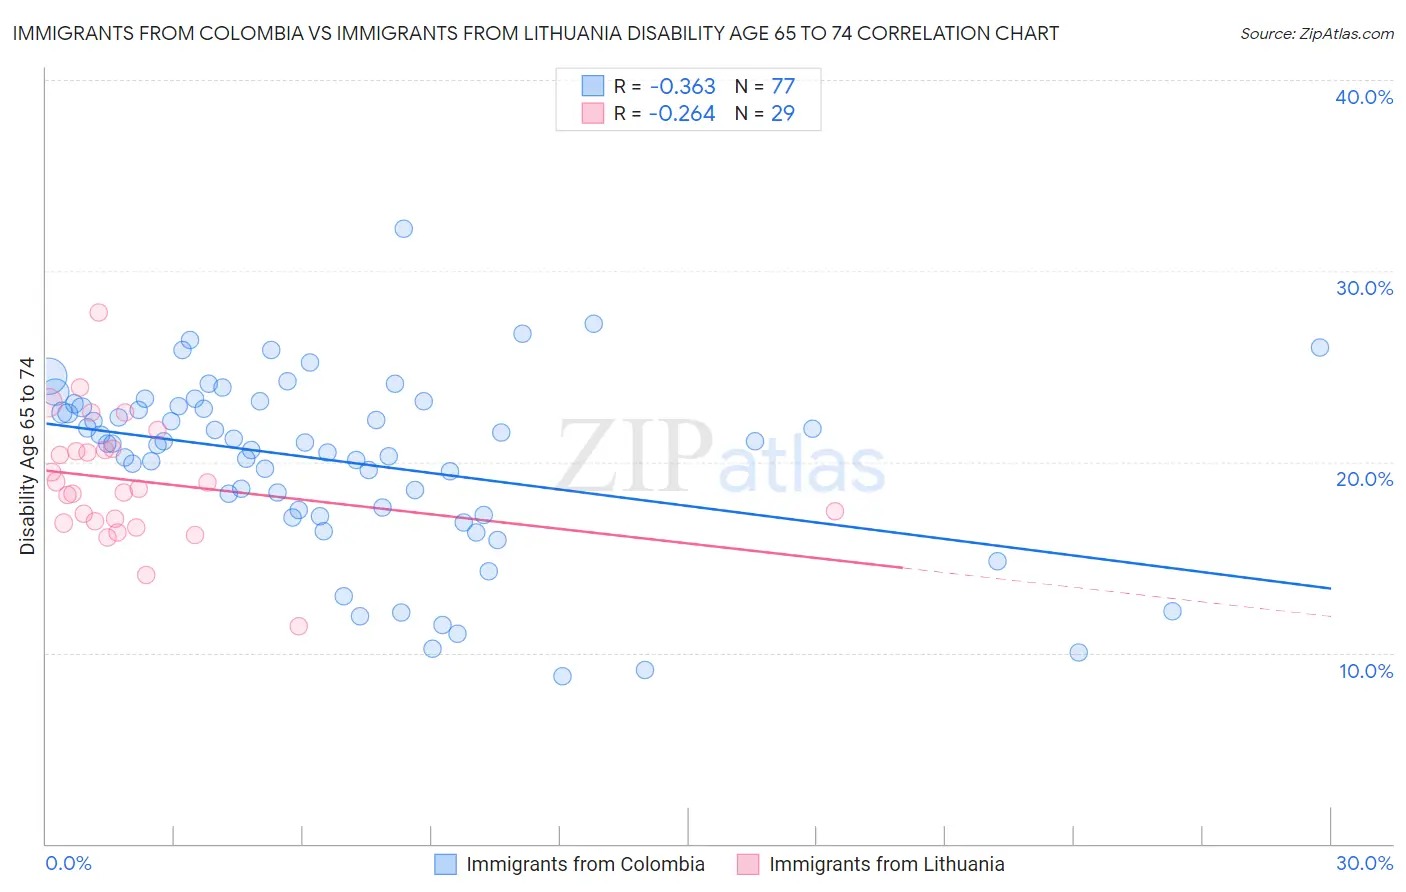
Immigrants from Colombia vs Immigrants from Lithuania Disability Age 65 to 74 Correlation Chart
The statistical analysis conducted on geographies consisting of 378,083,554 people shows a mild negative correlation between the proportion of Immigrants from Colombia and percentage of population with a disability between the ages 65 and 75 in the United States with a correlation coefficient (R) of -0.363 and weighted average of 22.2%. Similarly, the statistical analysis conducted on geographies consisting of 117,698,011 people shows a weak negative correlation between the proportion of Immigrants from Lithuania and percentage of population with a disability between the ages 65 and 75 in the United States with a correlation coefficient (R) of -0.264 and weighted average of 20.5%, a difference of 7.9%.
Disability Age 65 to 74 Correlation Summary
| Measurement | Immigrants from Colombia | Immigrants from Lithuania |
| Minimum | 8.8% | 11.4% |
| Maximum | 32.2% | 27.8% |
| Range | 23.4% | 16.5% |
| Mean | 20.0% | 19.0% |
| Median | 21.0% | 18.6% |
| Interquartile 25% (IQ1) | 17.3% | 16.8% |
| Interquartile 75% (IQ3) | 23.0% | 20.7% |
| Interquartile Range (IQR) | 5.6% | 3.8% |
| Standard Deviation (Sample) | 4.7% | 3.3% |
| Standard Deviation (Population) | 4.6% | 3.2% |
Similar Demographics by Disability Age 65 to 74
Demographics Similar to Immigrants from Colombia by Disability Age 65 to 74
In terms of disability age 65 to 74, the demographic groups most similar to Immigrants from Colombia are Jordanian (22.2%, a difference of 0.030%), Uruguayan (22.2%, a difference of 0.13%), Immigrants from England (22.2%, a difference of 0.14%), Immigrants from Saudi Arabia (22.2%, a difference of 0.17%), and South American (22.2%, a difference of 0.19%).
| Demographics | Rating | Rank | Disability Age 65 to 74 |
| Poles | 97.8 /100 | #92 | Exceptional 22.0% |
| Immigrants | Canada | 97.8 /100 | #93 | Exceptional 22.1% |
| Immigrants | Chile | 97.7 /100 | #94 | Exceptional 22.1% |
| Romanians | 97.7 /100 | #95 | Exceptional 22.1% |
| Immigrants | North America | 97.5 /100 | #96 | Exceptional 22.1% |
| Immigrants | Southern Europe | 97.2 /100 | #97 | Exceptional 22.1% |
| Jordanians | 96.9 /100 | #98 | Exceptional 22.2% |
| Immigrants | Colombia | 96.8 /100 | #99 | Exceptional 22.2% |
| Uruguayans | 96.5 /100 | #100 | Exceptional 22.2% |
| Immigrants | England | 96.5 /100 | #101 | Exceptional 22.2% |
| Immigrants | Saudi Arabia | 96.4 /100 | #102 | Exceptional 22.2% |
| South Americans | 96.4 /100 | #103 | Exceptional 22.2% |
| Colombians | 96.4 /100 | #104 | Exceptional 22.2% |
| Palestinians | 96.3 /100 | #105 | Exceptional 22.2% |
| Peruvians | 96.1 /100 | #106 | Exceptional 22.2% |
Demographics Similar to Immigrants from Lithuania by Disability Age 65 to 74
In terms of disability age 65 to 74, the demographic groups most similar to Immigrants from Lithuania are Paraguayan (20.5%, a difference of 0.060%), Indian (Asian) (20.5%, a difference of 0.080%), Immigrants from South Central Asia (20.6%, a difference of 0.25%), Eastern European (20.6%, a difference of 0.32%), and Burmese (20.6%, a difference of 0.35%).
| Demographics | Rating | Rank | Disability Age 65 to 74 |
| Immigrants | China | 100.0 /100 | #9 | Exceptional 20.3% |
| Immigrants | Eastern Asia | 100.0 /100 | #10 | Exceptional 20.3% |
| Immigrants | Ireland | 100.0 /100 | #11 | Exceptional 20.3% |
| Immigrants | Korea | 100.0 /100 | #12 | Exceptional 20.4% |
| Immigrants | Singapore | 100.0 /100 | #13 | Exceptional 20.4% |
| Indians (Asian) | 100.0 /100 | #14 | Exceptional 20.5% |
| Paraguayans | 100.0 /100 | #15 | Exceptional 20.5% |
| Immigrants | Lithuania | 100.0 /100 | #16 | Exceptional 20.5% |
| Immigrants | South Central Asia | 100.0 /100 | #17 | Exceptional 20.6% |
| Eastern Europeans | 100.0 /100 | #18 | Exceptional 20.6% |
| Burmese | 100.0 /100 | #19 | Exceptional 20.6% |
| Okinawans | 100.0 /100 | #20 | Exceptional 20.7% |
| Immigrants | Bolivia | 99.9 /100 | #21 | Exceptional 20.8% |
| Immigrants | Iran | 99.9 /100 | #22 | Exceptional 20.9% |
| Immigrants | Belgium | 99.9 /100 | #23 | Exceptional 21.0% |