Immigrants from Indonesia vs Immigrants from Central America Disability Age Under 5
COMPARE
Immigrants from Indonesia
Immigrants from Central America
Disability Age Under 5
Disability Age Under 5 Comparison
Immigrants from Indonesia
Immigrants from Central America
1.1%
DISABILITY AGE UNDER 5
98.7/ 100
METRIC RATING
66th/ 347
METRIC RANK
1.2%
DISABILITY AGE UNDER 5
61.4/ 100
METRIC RATING
166th/ 347
METRIC RANK
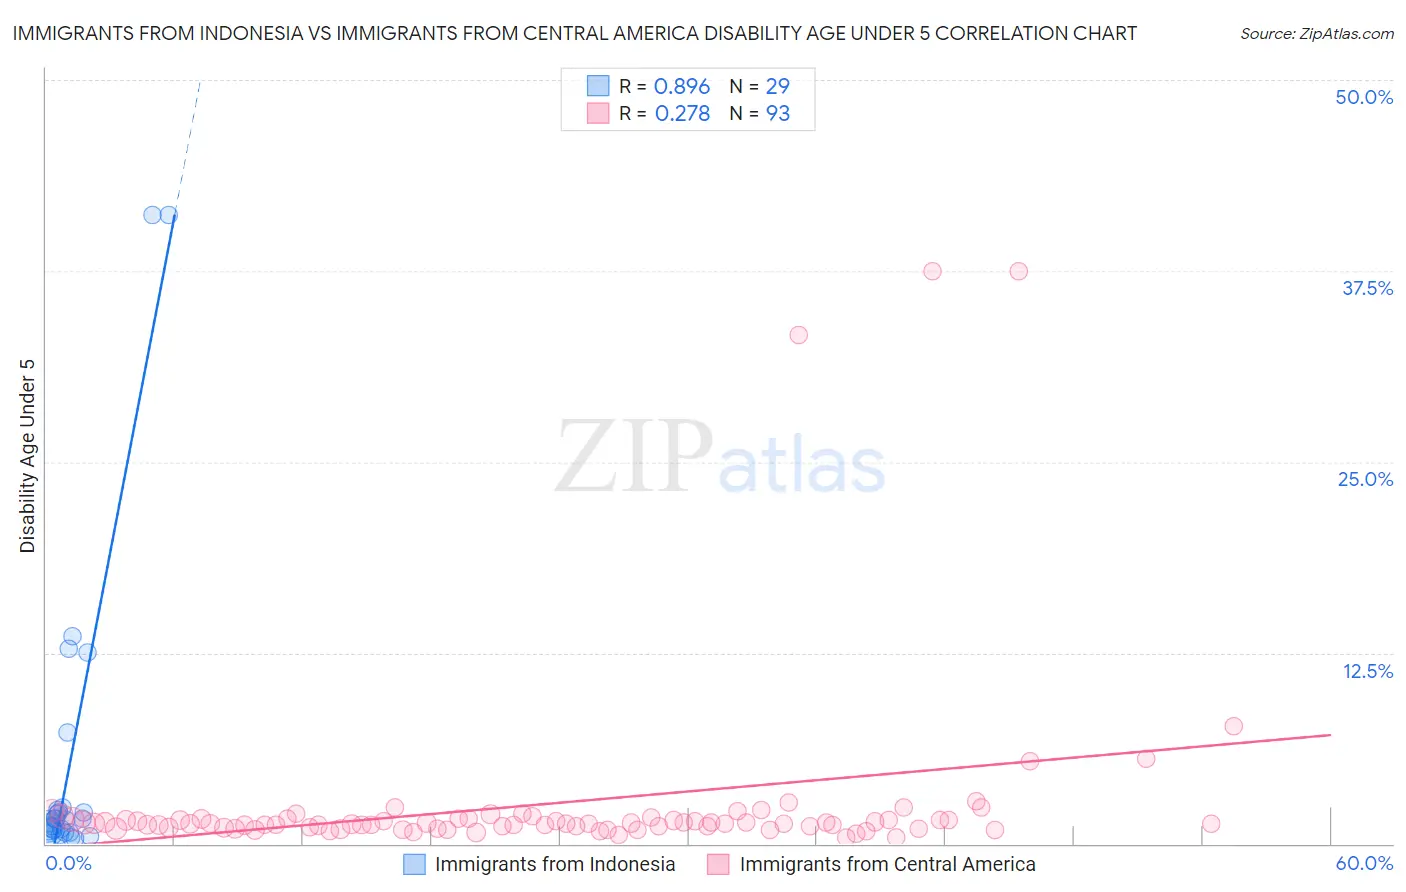
Immigrants from Indonesia vs Immigrants from Central America Disability Age Under 5 Correlation Chart
The statistical analysis conducted on geographies consisting of 141,877,475 people shows a very strong positive correlation between the proportion of Immigrants from Indonesia and percentage of population with a disability under the age of 5 in the United States with a correlation coefficient (R) of 0.896 and weighted average of 1.1%. Similarly, the statistical analysis conducted on geographies consisting of 255,387,809 people shows a weak positive correlation between the proportion of Immigrants from Central America and percentage of population with a disability under the age of 5 in the United States with a correlation coefficient (R) of 0.278 and weighted average of 1.2%, a difference of 9.8%.
Disability Age Under 5 Correlation Summary
| Measurement | Immigrants from Indonesia | Immigrants from Central America |
| Minimum | 0.33% | 0.41% |
| Maximum | 41.2% | 37.5% |
| Range | 40.8% | 37.1% |
| Mean | 5.4% | 2.6% |
| Median | 1.5% | 1.3% |
| Interquartile 25% (IQ1) | 0.90% | 1.1% |
| Interquartile 75% (IQ3) | 2.3% | 1.6% |
| Interquartile Range (IQR) | 1.4% | 0.53% |
| Standard Deviation (Sample) | 10.6% | 6.2% |
| Standard Deviation (Population) | 10.4% | 6.2% |
Similar Demographics by Disability Age Under 5
Demographics Similar to Immigrants from Indonesia by Disability Age Under 5
In terms of disability age under 5, the demographic groups most similar to Immigrants from Indonesia are Immigrants from Belize (1.1%, a difference of 0.070%), South African (1.1%, a difference of 0.10%), Immigrants from Korea (1.1%, a difference of 0.13%), Israeli (1.1%, a difference of 0.13%), and Immigrants from Ecuador (1.1%, a difference of 0.22%).
| Demographics | Rating | Rank | Disability Age Under 5 |
| Immigrants | Malaysia | 99.4 /100 | #59 | Exceptional 1.1% |
| Immigrants | Western Asia | 99.2 /100 | #60 | Exceptional 1.1% |
| Immigrants | Ethiopia | 99.2 /100 | #61 | Exceptional 1.1% |
| Immigrants | Switzerland | 99.2 /100 | #62 | Exceptional 1.1% |
| Immigrants | Vietnam | 99.1 /100 | #63 | Exceptional 1.1% |
| Egyptians | 98.9 /100 | #64 | Exceptional 1.1% |
| Immigrants | Korea | 98.8 /100 | #65 | Exceptional 1.1% |
| Immigrants | Indonesia | 98.7 /100 | #66 | Exceptional 1.1% |
| Immigrants | Belize | 98.7 /100 | #67 | Exceptional 1.1% |
| South Africans | 98.7 /100 | #68 | Exceptional 1.1% |
| Israelis | 98.7 /100 | #69 | Exceptional 1.1% |
| Immigrants | Ecuador | 98.6 /100 | #70 | Exceptional 1.1% |
| Trinidadians and Tobagonians | 98.6 /100 | #71 | Exceptional 1.1% |
| Burmese | 98.5 /100 | #72 | Exceptional 1.1% |
| Immigrants | Sri Lanka | 98.5 /100 | #73 | Exceptional 1.1% |
Demographics Similar to Immigrants from Central America by Disability Age Under 5
In terms of disability age under 5, the demographic groups most similar to Immigrants from Central America are Immigrants from Kuwait (1.2%, a difference of 0.11%), Immigrants from Argentina (1.2%, a difference of 0.11%), Laotian (1.2%, a difference of 0.13%), Immigrants from Guatemala (1.2%, a difference of 0.18%), and Guatemalan (1.2%, a difference of 0.21%).
| Demographics | Rating | Rank | Disability Age Under 5 |
| Colombians | 65.8 /100 | #159 | Good 1.2% |
| Immigrants | Latin America | 65.8 /100 | #160 | Good 1.2% |
| Immigrants | Africa | 65.1 /100 | #161 | Good 1.2% |
| Guatemalans | 63.6 /100 | #162 | Good 1.2% |
| Immigrants | Guatemala | 63.2 /100 | #163 | Good 1.2% |
| Laotians | 62.8 /100 | #164 | Good 1.2% |
| Immigrants | Kuwait | 62.6 /100 | #165 | Good 1.2% |
| Immigrants | Central America | 61.4 /100 | #166 | Good 1.2% |
| Immigrants | Argentina | 60.2 /100 | #167 | Good 1.2% |
| Sierra Leoneans | 59.1 /100 | #168 | Average 1.2% |
| Immigrants | Uruguay | 59.0 /100 | #169 | Average 1.2% |
| Immigrants | Jamaica | 58.8 /100 | #170 | Average 1.2% |
| Guamanians/Chamorros | 57.8 /100 | #171 | Average 1.2% |
| Crow | 51.0 /100 | #172 | Average 1.2% |
| Immigrants | Ireland | 50.3 /100 | #173 | Average 1.2% |