Turkish vs Alaska Native Disability Age 18 to 34
COMPARE
Turkish
Alaska Native
Disability Age 18 to 34
Disability Age 18 to 34 Comparison
Turks
Alaska Natives
6.2%
DISABILITY AGE 18 TO 34
97.8/ 100
METRIC RATING
89th/ 347
METRIC RANK
7.8%
DISABILITY AGE 18 TO 34
0.0/ 100
METRIC RATING
309th/ 347
METRIC RANK
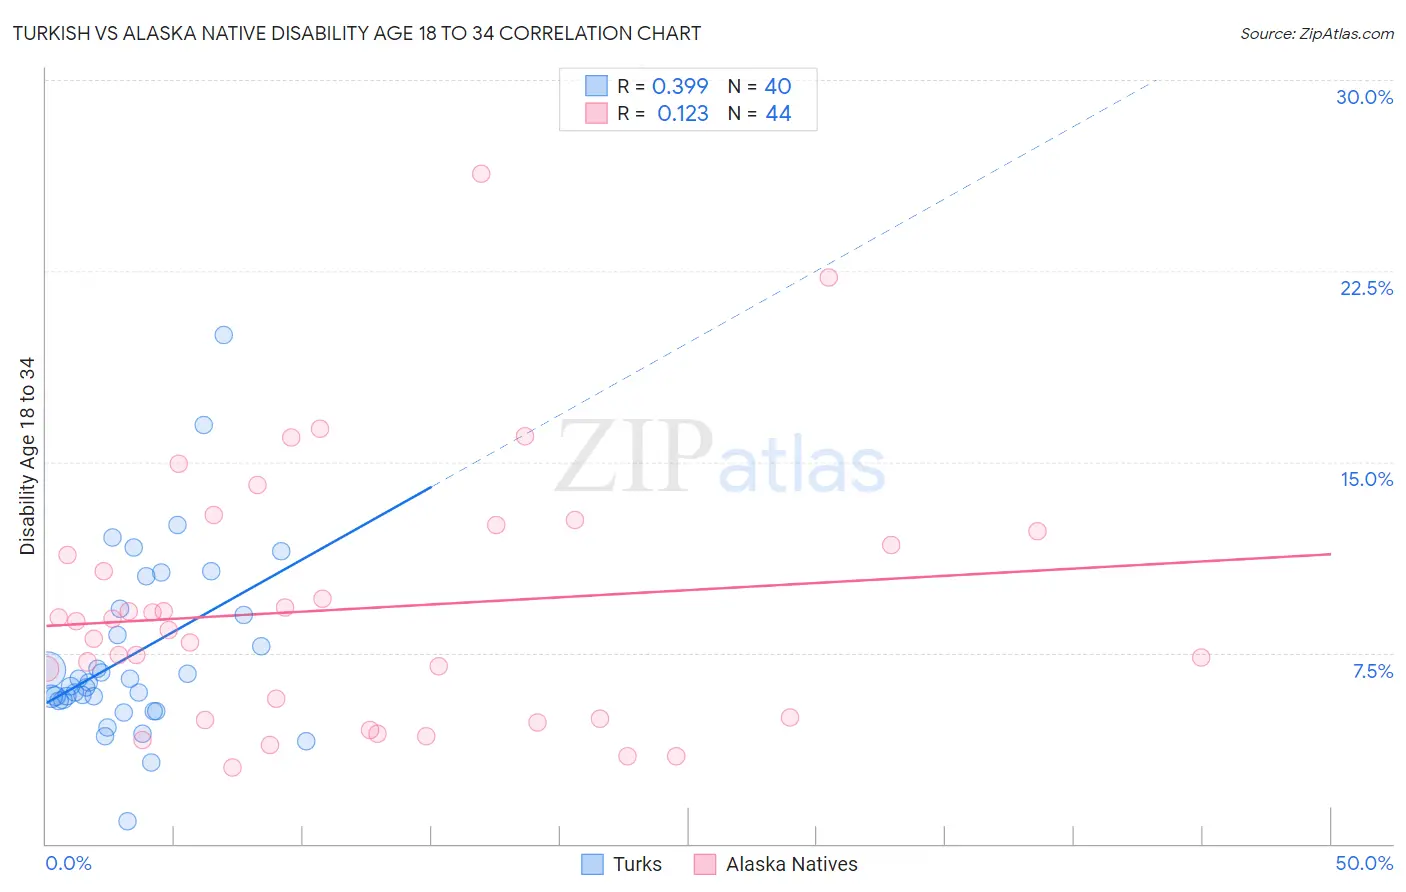
Turkish vs Alaska Native Disability Age 18 to 34 Correlation Chart
The statistical analysis conducted on geographies consisting of 271,484,805 people shows a mild positive correlation between the proportion of Turks and percentage of population with a disability between the ages 18 and 35 in the United States with a correlation coefficient (R) of 0.399 and weighted average of 6.2%. Similarly, the statistical analysis conducted on geographies consisting of 76,695,131 people shows a poor positive correlation between the proportion of Alaska Natives and percentage of population with a disability between the ages 18 and 35 in the United States with a correlation coefficient (R) of 0.123 and weighted average of 7.8%, a difference of 26.6%.
Disability Age 18 to 34 Correlation Summary
| Measurement | Turkish | Alaska Native |
| Minimum | 0.89% | 3.0% |
| Maximum | 20.0% | 26.3% |
| Range | 19.1% | 23.3% |
| Mean | 7.4% | 9.2% |
| Median | 6.3% | 8.6% |
| Interquartile 25% (IQ1) | 5.6% | 4.9% |
| Interquartile 75% (IQ3) | 9.1% | 12.0% |
| Interquartile Range (IQR) | 3.5% | 7.1% |
| Standard Deviation (Sample) | 3.6% | 5.0% |
| Standard Deviation (Population) | 3.6% | 4.9% |
Similar Demographics by Disability Age 18 to 34
Demographics Similar to Turks by Disability Age 18 to 34
In terms of disability age 18 to 34, the demographic groups most similar to Turks are Immigrants from Vietnam (6.2%, a difference of 0.040%), Cambodian (6.2%, a difference of 0.060%), Immigrants from Eastern Europe (6.2%, a difference of 0.090%), Immigrants from Philippines (6.2%, a difference of 0.11%), and Jordanian (6.2%, a difference of 0.16%).
| Demographics | Rating | Rank | Disability Age 18 to 34 |
| Immigrants | Northern Africa | 98.4 /100 | #82 | Exceptional 6.1% |
| Barbadians | 98.3 /100 | #83 | Exceptional 6.1% |
| Israelis | 98.3 /100 | #84 | Exceptional 6.1% |
| Immigrants | Ireland | 98.2 /100 | #85 | Exceptional 6.1% |
| Immigrants | Kuwait | 98.0 /100 | #86 | Exceptional 6.2% |
| Immigrants | Eastern Europe | 97.9 /100 | #87 | Exceptional 6.2% |
| Cambodians | 97.8 /100 | #88 | Exceptional 6.2% |
| Turks | 97.8 /100 | #89 | Exceptional 6.2% |
| Immigrants | Vietnam | 97.7 /100 | #90 | Exceptional 6.2% |
| Immigrants | Philippines | 97.6 /100 | #91 | Exceptional 6.2% |
| Jordanians | 97.6 /100 | #92 | Exceptional 6.2% |
| Immigrants | Immigrants | 97.6 /100 | #93 | Exceptional 6.2% |
| Immigrants | Kazakhstan | 97.5 /100 | #94 | Exceptional 6.2% |
| Central Americans | 97.5 /100 | #95 | Exceptional 6.2% |
| Immigrants | Uruguay | 97.4 /100 | #96 | Exceptional 6.2% |
Demographics Similar to Alaska Natives by Disability Age 18 to 34
In terms of disability age 18 to 34, the demographic groups most similar to Alaska Natives are Pennsylvania German (7.8%, a difference of 0.010%), Scotch-Irish (7.8%, a difference of 0.040%), Finnish (7.8%, a difference of 0.060%), English (7.8%, a difference of 0.30%), and Menominee (7.8%, a difference of 0.38%).
| Demographics | Rating | Rank | Disability Age 18 to 34 |
| Welsh | 0.0 /100 | #302 | Tragic 7.7% |
| Cheyenne | 0.0 /100 | #303 | Tragic 7.7% |
| Shoshone | 0.0 /100 | #304 | Tragic 7.8% |
| Menominee | 0.0 /100 | #305 | Tragic 7.8% |
| English | 0.0 /100 | #306 | Tragic 7.8% |
| Scotch-Irish | 0.0 /100 | #307 | Tragic 7.8% |
| Pennsylvania Germans | 0.0 /100 | #308 | Tragic 7.8% |
| Alaska Natives | 0.0 /100 | #309 | Tragic 7.8% |
| Finns | 0.0 /100 | #310 | Tragic 7.8% |
| French | 0.0 /100 | #311 | Tragic 7.9% |
| Spanish Americans | 0.0 /100 | #312 | Tragic 7.9% |
| Iroquois | 0.0 /100 | #313 | Tragic 7.9% |
| Colville | 0.0 /100 | #314 | Tragic 7.9% |
| Americans | 0.0 /100 | #315 | Tragic 8.0% |
| Puerto Ricans | 0.0 /100 | #316 | Tragic 8.0% |