Austrian vs Filipino Vision Disability
COMPARE
Austrian
Filipino
Vision Disability
Vision Disability Comparison
Austrians
Filipinos
2.1%
VISION DISABILITY
69.0/ 100
METRIC RATING
160th/ 347
METRIC RANK
1.7%
VISION DISABILITY
100.0/ 100
METRIC RATING
2nd/ 347
METRIC RANK
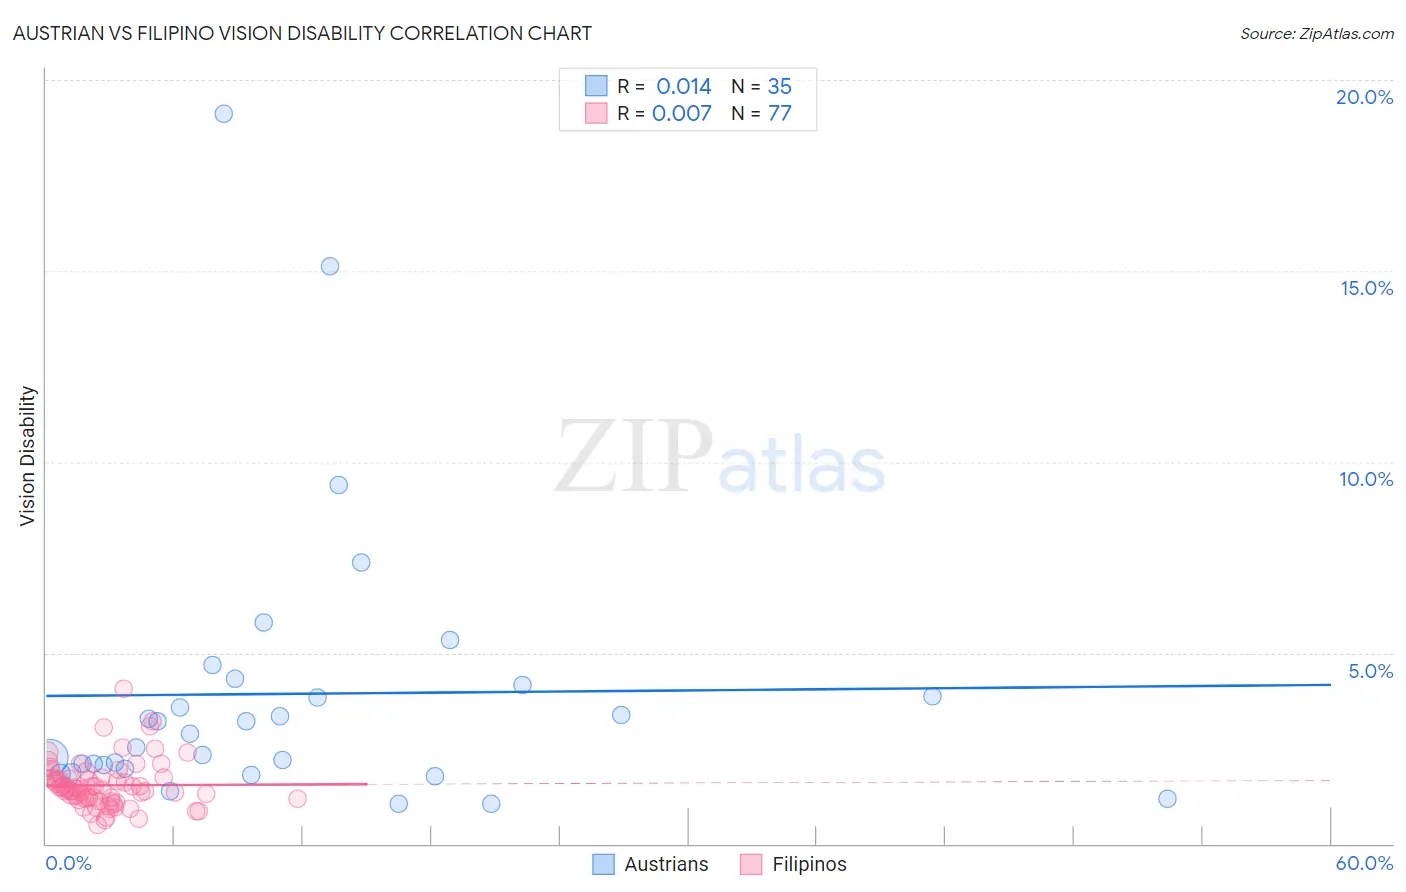
Austrian vs Filipino Vision Disability Correlation Chart
The statistical analysis conducted on geographies consisting of 451,572,198 people shows no correlation between the proportion of Austrians and percentage of population with vision disability in the United States with a correlation coefficient (R) of 0.014 and weighted average of 2.1%. Similarly, the statistical analysis conducted on geographies consisting of 254,226,053 people shows no correlation between the proportion of Filipinos and percentage of population with vision disability in the United States with a correlation coefficient (R) of 0.007 and weighted average of 1.7%, a difference of 27.0%.
Vision Disability Correlation Summary
| Measurement | Austrian | Filipino |
| Minimum | 1.0% | 0.48% |
| Maximum | 19.1% | 4.1% |
| Range | 18.1% | 3.6% |
| Mean | 3.9% | 1.5% |
| Median | 2.9% | 1.4% |
| Interquartile 25% (IQ1) | 2.0% | 1.2% |
| Interquartile 75% (IQ3) | 4.2% | 1.7% |
| Interquartile Range (IQR) | 2.2% | 0.53% |
| Standard Deviation (Sample) | 3.8% | 0.61% |
| Standard Deviation (Population) | 3.7% | 0.61% |
Similar Demographics by Vision Disability
Demographics Similar to Austrians by Vision Disability
In terms of vision disability, the demographic groups most similar to Austrians are South African (2.1%, a difference of 0.060%), Immigrants from Uzbekistan (2.1%, a difference of 0.070%), Serbian (2.1%, a difference of 0.090%), Iraqi (2.1%, a difference of 0.090%), and Hungarian (2.1%, a difference of 0.12%).
| Demographics | Rating | Rank | Vision Disability |
| Immigrants | South America | 73.8 /100 | #153 | Good 2.1% |
| Slovenes | 73.6 /100 | #154 | Good 2.1% |
| Immigrants | Colombia | 72.1 /100 | #155 | Good 2.1% |
| Pakistanis | 71.6 /100 | #156 | Good 2.1% |
| Serbians | 70.2 /100 | #157 | Good 2.1% |
| Immigrants | Uzbekistan | 69.9 /100 | #158 | Good 2.1% |
| South Africans | 69.8 /100 | #159 | Good 2.1% |
| Austrians | 69.0 /100 | #160 | Good 2.1% |
| Iraqis | 67.7 /100 | #161 | Good 2.1% |
| Hungarians | 67.4 /100 | #162 | Good 2.1% |
| Icelanders | 66.1 /100 | #163 | Good 2.1% |
| Immigrants | Bangladesh | 65.5 /100 | #164 | Good 2.1% |
| Immigrants | Iraq | 64.8 /100 | #165 | Good 2.1% |
| Immigrants | England | 62.8 /100 | #166 | Good 2.1% |
| Immigrants | Africa | 62.6 /100 | #167 | Good 2.1% |
Demographics Similar to Filipinos by Vision Disability
In terms of vision disability, the demographic groups most similar to Filipinos are Immigrants from India (1.7%, a difference of 0.050%), Immigrants from Taiwan (1.7%, a difference of 0.65%), Thai (1.7%, a difference of 3.3%), Okinawan (1.8%, a difference of 5.3%), and Immigrants from Iran (1.8%, a difference of 5.9%).
| Demographics | Rating | Rank | Vision Disability |
| Immigrants | India | 100.0 /100 | #1 | Exceptional 1.7% |
| Filipinos | 100.0 /100 | #2 | Exceptional 1.7% |
| Immigrants | Taiwan | 100.0 /100 | #3 | Exceptional 1.7% |
| Thais | 100.0 /100 | #4 | Exceptional 1.7% |
| Okinawans | 100.0 /100 | #5 | Exceptional 1.8% |
| Immigrants | Iran | 100.0 /100 | #6 | Exceptional 1.8% |
| Immigrants | South Central Asia | 100.0 /100 | #7 | Exceptional 1.8% |
| Iranians | 100.0 /100 | #8 | Exceptional 1.8% |
| Immigrants | Singapore | 100.0 /100 | #9 | Exceptional 1.8% |
| Immigrants | Hong Kong | 100.0 /100 | #10 | Exceptional 1.8% |
| Immigrants | Israel | 100.0 /100 | #11 | Exceptional 1.8% |
| Immigrants | Korea | 100.0 /100 | #12 | Exceptional 1.8% |
| Immigrants | Eastern Asia | 100.0 /100 | #13 | Exceptional 1.8% |
| Immigrants | China | 100.0 /100 | #14 | Exceptional 1.8% |
| Immigrants | Bolivia | 100.0 /100 | #15 | Exceptional 1.8% |