Asian vs Sierra Leonean Unemployment Among Ages 60 to 64 years
COMPARE
Asian
Sierra Leonean
Unemployment Among Ages 60 to 64 years
Unemployment Among Ages 60 to 64 years Comparison
Asians
Sierra Leoneans
4.9%
UNEMPLOYMENT AMONG AGES 60 TO 64 YEARS
40.8/ 100
METRIC RATING
180th/ 347
METRIC RANK
4.9%
UNEMPLOYMENT AMONG AGES 60 TO 64 YEARS
16.5/ 100
METRIC RATING
209th/ 347
METRIC RANK
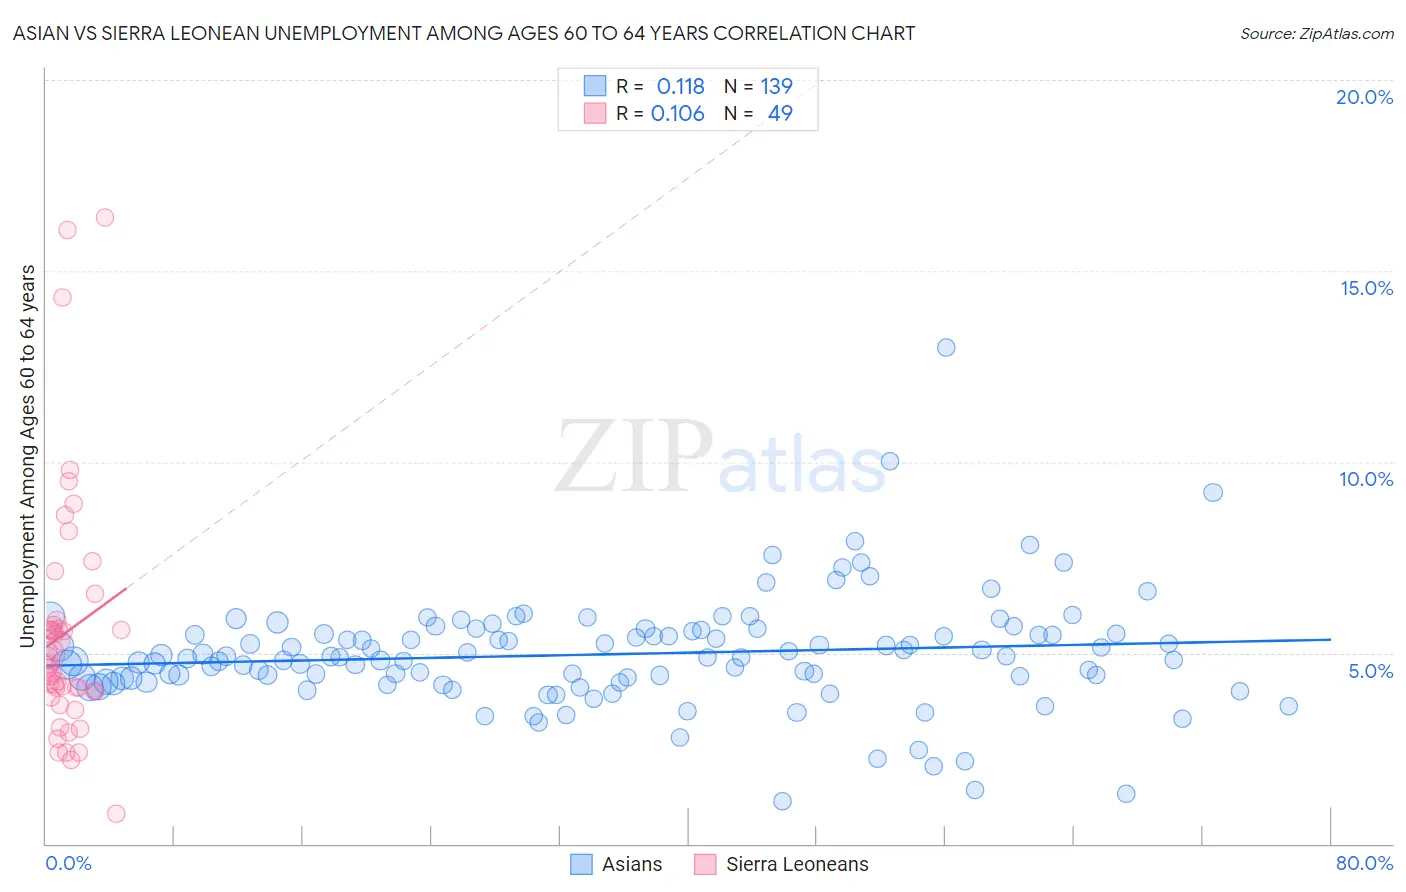
Asian vs Sierra Leonean Unemployment Among Ages 60 to 64 years Correlation Chart
The statistical analysis conducted on geographies consisting of 460,909,044 people shows a poor positive correlation between the proportion of Asians and unemployment rate among population between the ages 60 and 64 in the United States with a correlation coefficient (R) of 0.118 and weighted average of 4.9%. Similarly, the statistical analysis conducted on geographies consisting of 81,145,085 people shows a poor positive correlation between the proportion of Sierra Leoneans and unemployment rate among population between the ages 60 and 64 in the United States with a correlation coefficient (R) of 0.106 and weighted average of 4.9%, a difference of 1.1%.
Unemployment Among Ages 60 to 64 years Correlation Summary
| Measurement | Asian | Sierra Leonean |
| Minimum | 1.1% | 0.80% |
| Maximum | 13.0% | 16.4% |
| Range | 11.9% | 15.6% |
| Mean | 5.0% | 5.5% |
| Median | 4.9% | 4.7% |
| Interquartile 25% (IQ1) | 4.2% | 3.9% |
| Interquartile 75% (IQ3) | 5.5% | 5.8% |
| Interquartile Range (IQR) | 1.3% | 1.9% |
| Standard Deviation (Sample) | 1.5% | 3.2% |
| Standard Deviation (Population) | 1.5% | 3.2% |
Similar Demographics by Unemployment Among Ages 60 to 64 years
Demographics Similar to Asians by Unemployment Among Ages 60 to 64 years
In terms of unemployment among ages 60 to 64 years, the demographic groups most similar to Asians are Hungarian (4.9%, a difference of 0.0%), Sri Lankan (4.9%, a difference of 0.040%), Subsaharan African (4.9%, a difference of 0.070%), Immigrants from Ukraine (4.9%, a difference of 0.12%), and Ute (4.9%, a difference of 0.12%).
| Demographics | Rating | Rank | Unemployment Among Ages 60 to 64 years |
| Immigrants | Hungary | 50.2 /100 | #173 | Average 4.9% |
| Immigrants | Western Europe | 50.0 /100 | #174 | Average 4.9% |
| Immigrants | Latvia | 46.9 /100 | #175 | Average 4.9% |
| Bermudans | 46.5 /100 | #176 | Average 4.9% |
| Immigrants | Malaysia | 44.7 /100 | #177 | Average 4.9% |
| Immigrants | Nonimmigrants | 44.5 /100 | #178 | Average 4.9% |
| Immigrants | Sweden | 44.3 /100 | #179 | Average 4.9% |
| Asians | 40.8 /100 | #180 | Average 4.9% |
| Hungarians | 40.6 /100 | #181 | Average 4.9% |
| Sri Lankans | 39.8 /100 | #182 | Fair 4.9% |
| Sub-Saharan Africans | 38.9 /100 | #183 | Fair 4.9% |
| Immigrants | Ukraine | 37.6 /100 | #184 | Fair 4.9% |
| Ute | 37.4 /100 | #185 | Fair 4.9% |
| Spaniards | 35.8 /100 | #186 | Fair 4.9% |
| South American Indians | 31.2 /100 | #187 | Fair 4.9% |
Demographics Similar to Sierra Leoneans by Unemployment Among Ages 60 to 64 years
In terms of unemployment among ages 60 to 64 years, the demographic groups most similar to Sierra Leoneans are German Russian (4.9%, a difference of 0.010%), Cherokee (4.9%, a difference of 0.030%), Chippewa (4.9%, a difference of 0.050%), Blackfeet (4.9%, a difference of 0.050%), and Immigrants from Indonesia (4.9%, a difference of 0.060%).
| Demographics | Rating | Rank | Unemployment Among Ages 60 to 64 years |
| Immigrants | Western Africa | 20.6 /100 | #202 | Fair 4.9% |
| Uruguayans | 19.9 /100 | #203 | Poor 4.9% |
| Russians | 18.9 /100 | #204 | Poor 4.9% |
| Immigrants | Indonesia | 17.4 /100 | #205 | Poor 4.9% |
| New Zealanders | 17.4 /100 | #206 | Poor 4.9% |
| Chippewa | 17.3 /100 | #207 | Poor 4.9% |
| German Russians | 16.8 /100 | #208 | Poor 4.9% |
| Sierra Leoneans | 16.5 /100 | #209 | Poor 4.9% |
| Cherokee | 16.1 /100 | #210 | Poor 4.9% |
| Blackfeet | 15.7 /100 | #211 | Poor 4.9% |
| Moroccans | 15.0 /100 | #212 | Poor 4.9% |
| Eastern Europeans | 14.3 /100 | #213 | Poor 4.9% |
| Immigrants | Russia | 13.7 /100 | #214 | Poor 4.9% |
| Immigrants | South Eastern Asia | 13.1 /100 | #215 | Poor 4.9% |
| Cajuns | 12.3 /100 | #216 | Poor 4.9% |