Panamanian vs Paraguayan Disability Age 35 to 64
COMPARE
Panamanian
Paraguayan
Disability Age 35 to 64
Disability Age 35 to 64 Comparison
Panamanians
Paraguayans
11.9%
DISABILITY AGE 35 TO 64
5.8/ 100
METRIC RATING
230th/ 347
METRIC RANK
9.8%
DISABILITY AGE 35 TO 64
99.8/ 100
METRIC RATING
50th/ 347
METRIC RANK
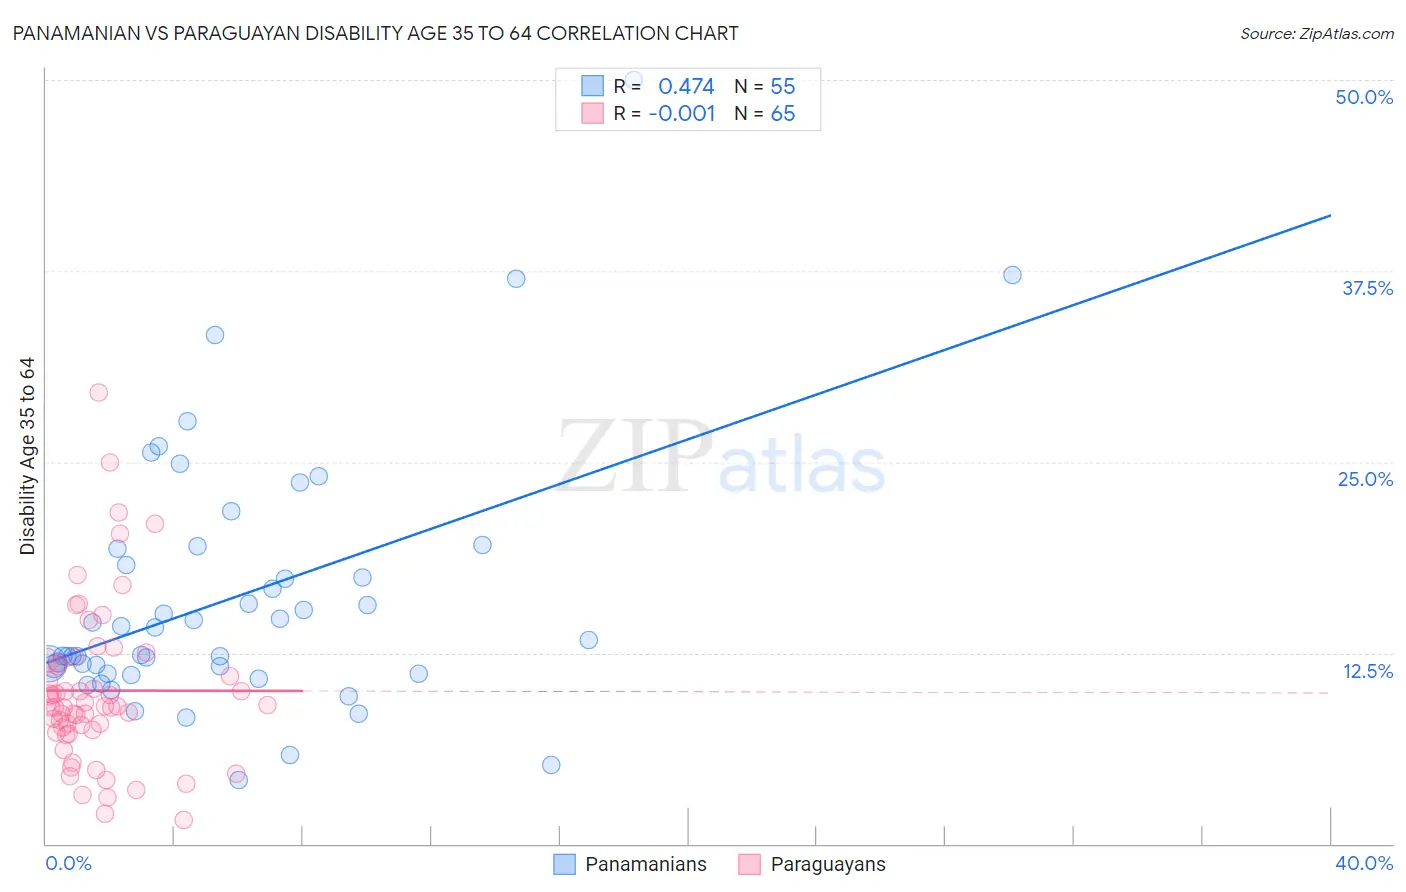
Panamanian vs Paraguayan Disability Age 35 to 64 Correlation Chart
The statistical analysis conducted on geographies consisting of 281,055,703 people shows a moderate positive correlation between the proportion of Panamanians and percentage of population with a disability between the ages 34 and 64 in the United States with a correlation coefficient (R) of 0.474 and weighted average of 11.9%. Similarly, the statistical analysis conducted on geographies consisting of 95,099,439 people shows no correlation between the proportion of Paraguayans and percentage of population with a disability between the ages 34 and 64 in the United States with a correlation coefficient (R) of -0.001 and weighted average of 9.8%, a difference of 21.1%.
Disability Age 35 to 64 Correlation Summary
| Measurement | Panamanian | Paraguayan |
| Minimum | 4.1% | 1.6% |
| Maximum | 50.0% | 29.5% |
| Range | 45.9% | 28.0% |
| Mean | 16.2% | 10.0% |
| Median | 13.3% | 9.0% |
| Interquartile 25% (IQ1) | 11.2% | 7.4% |
| Interquartile 75% (IQ3) | 19.3% | 11.9% |
| Interquartile Range (IQR) | 8.2% | 4.5% |
| Standard Deviation (Sample) | 8.6% | 5.3% |
| Standard Deviation (Population) | 8.5% | 5.3% |
Similar Demographics by Disability Age 35 to 64
Demographics Similar to Panamanians by Disability Age 35 to 64
In terms of disability age 35 to 64, the demographic groups most similar to Panamanians are Jamaican (11.9%, a difference of 0.030%), British West Indian (11.9%, a difference of 0.10%), Immigrants from Germany (11.9%, a difference of 0.12%), Immigrants from Central America (11.9%, a difference of 0.16%), and Sudanese (11.9%, a difference of 0.17%).
| Demographics | Rating | Rank | Disability Age 35 to 64 |
| Immigrants | Honduras | 8.4 /100 | #223 | Tragic 11.8% |
| Immigrants | Ghana | 7.8 /100 | #224 | Tragic 11.8% |
| Immigrants | Belize | 6.6 /100 | #225 | Tragic 11.9% |
| Scandinavians | 6.4 /100 | #226 | Tragic 11.9% |
| Immigrants | Central America | 6.3 /100 | #227 | Tragic 11.9% |
| Immigrants | Germany | 6.2 /100 | #228 | Tragic 11.9% |
| British West Indians | 6.1 /100 | #229 | Tragic 11.9% |
| Panamanians | 5.8 /100 | #230 | Tragic 11.9% |
| Jamaicans | 5.7 /100 | #231 | Tragic 11.9% |
| Sudanese | 5.3 /100 | #232 | Tragic 11.9% |
| Bermudans | 5.0 /100 | #233 | Tragic 11.9% |
| Portuguese | 4.9 /100 | #234 | Tragic 11.9% |
| Belizeans | 4.5 /100 | #235 | Tragic 12.0% |
| Immigrants | Middle Africa | 4.5 /100 | #236 | Tragic 12.0% |
| Immigrants | Cambodia | 3.9 /100 | #237 | Tragic 12.0% |
Demographics Similar to Paraguayans by Disability Age 35 to 64
In terms of disability age 35 to 64, the demographic groups most similar to Paraguayans are Immigrants from Greece (9.8%, a difference of 0.070%), Bhutanese (9.8%, a difference of 0.080%), Immigrants from Bulgaria (9.8%, a difference of 0.10%), Immigrants from Serbia (9.8%, a difference of 0.11%), and Immigrants from Belgium (9.8%, a difference of 0.12%).
| Demographics | Rating | Rank | Disability Age 35 to 64 |
| Immigrants | Colombia | 99.9 /100 | #43 | Exceptional 9.8% |
| Immigrants | Egypt | 99.9 /100 | #44 | Exceptional 9.8% |
| Immigrants | Peru | 99.9 /100 | #45 | Exceptional 9.8% |
| Cambodians | 99.8 /100 | #46 | Exceptional 9.8% |
| Immigrants | Belgium | 99.8 /100 | #47 | Exceptional 9.8% |
| Immigrants | Serbia | 99.8 /100 | #48 | Exceptional 9.8% |
| Immigrants | Greece | 99.8 /100 | #49 | Exceptional 9.8% |
| Paraguayans | 99.8 /100 | #50 | Exceptional 9.8% |
| Bhutanese | 99.8 /100 | #51 | Exceptional 9.8% |
| Immigrants | Bulgaria | 99.8 /100 | #52 | Exceptional 9.8% |
| Taiwanese | 99.8 /100 | #53 | Exceptional 9.8% |
| Immigrants | Russia | 99.8 /100 | #54 | Exceptional 9.8% |
| Peruvians | 99.8 /100 | #55 | Exceptional 9.9% |
| South Americans | 99.8 /100 | #56 | Exceptional 9.9% |
| Colombians | 99.8 /100 | #57 | Exceptional 9.9% |