Immigrants from Switzerland vs U.S. Virgin Islander Disability Age 35 to 64
COMPARE
Immigrants from Switzerland
U.S. Virgin Islander
Disability Age 35 to 64
Disability Age 35 to 64 Comparison
Immigrants from Switzerland
U.S. Virgin Islanders
10.1%
DISABILITY AGE 35 TO 64
99.5/ 100
METRIC RATING
68th/ 347
METRIC RANK
12.8%
DISABILITY AGE 35 TO 64
0.1/ 100
METRIC RATING
272nd/ 347
METRIC RANK
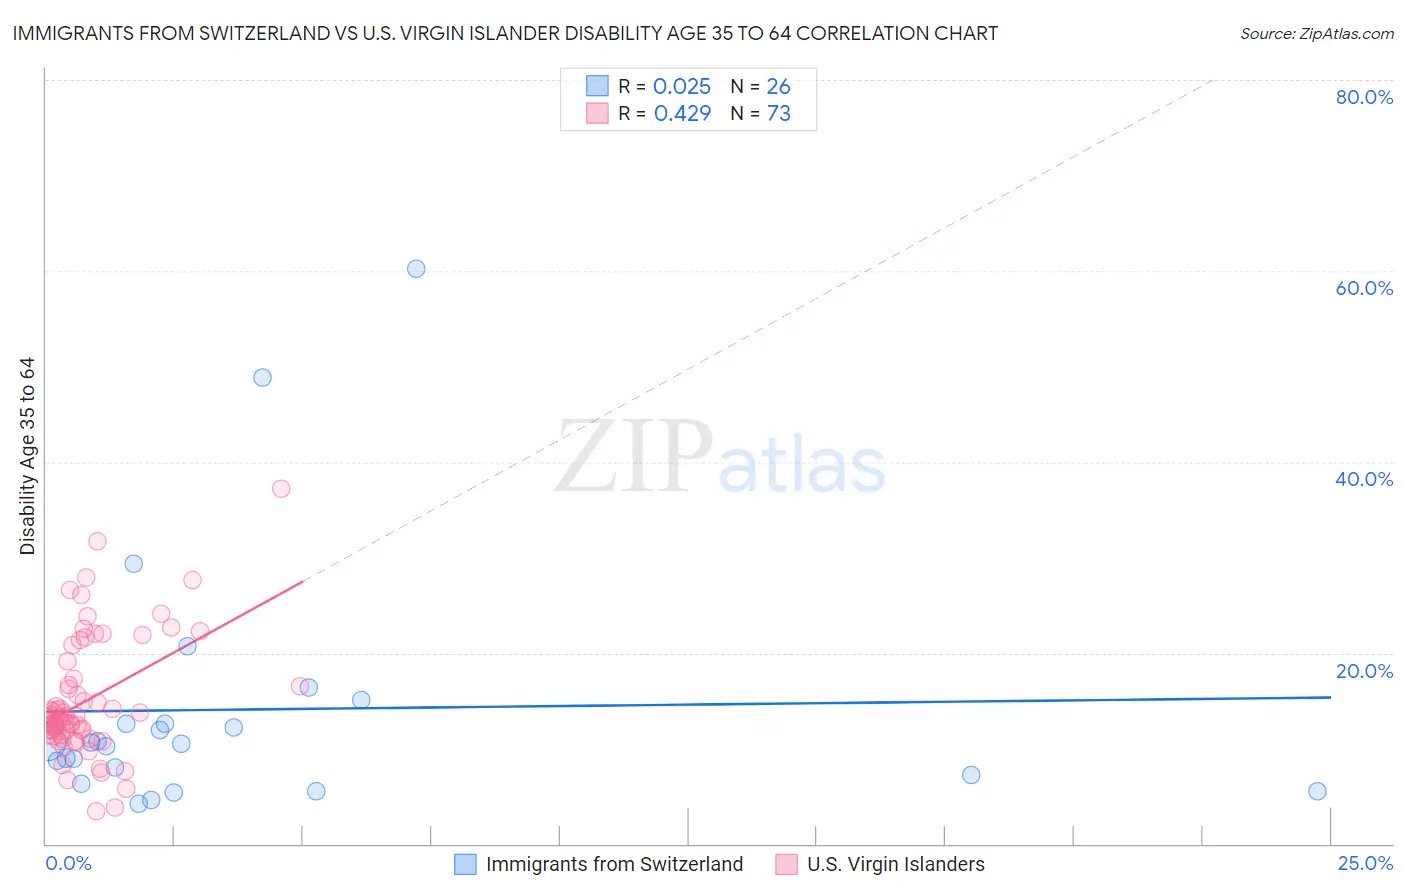
Immigrants from Switzerland vs U.S. Virgin Islander Disability Age 35 to 64 Correlation Chart
The statistical analysis conducted on geographies consisting of 148,054,150 people shows no correlation between the proportion of Immigrants from Switzerland and percentage of population with a disability between the ages 34 and 64 in the United States with a correlation coefficient (R) of 0.025 and weighted average of 10.1%. Similarly, the statistical analysis conducted on geographies consisting of 87,508,823 people shows a moderate positive correlation between the proportion of U.S. Virgin Islanders and percentage of population with a disability between the ages 34 and 64 in the United States with a correlation coefficient (R) of 0.429 and weighted average of 12.8%, a difference of 27.5%.
Disability Age 35 to 64 Correlation Summary
| Measurement | Immigrants from Switzerland | U.S. Virgin Islander |
| Minimum | 4.1% | 3.4% |
| Maximum | 60.2% | 37.1% |
| Range | 56.0% | 33.7% |
| Mean | 14.1% | 15.0% |
| Median | 10.5% | 13.2% |
| Interquartile 25% (IQ1) | 7.2% | 11.4% |
| Interquartile 75% (IQ3) | 12.6% | 18.3% |
| Interquartile Range (IQR) | 5.4% | 6.8% |
| Standard Deviation (Sample) | 13.1% | 6.4% |
| Standard Deviation (Population) | 12.9% | 6.3% |
Similar Demographics by Disability Age 35 to 64
Demographics Similar to Immigrants from Switzerland by Disability Age 35 to 64
In terms of disability age 35 to 64, the demographic groups most similar to Immigrants from Switzerland are Immigrants from Eastern Europe (10.1%, a difference of 0.020%), Immigrants from Nicaragua (10.1%, a difference of 0.030%), Immigrants from Kazakhstan (10.1%, a difference of 0.050%), Immigrants from Uzbekistan (10.1%, a difference of 0.11%), and Immigrants from Northern Europe (10.1%, a difference of 0.25%).
| Demographics | Rating | Rank | Disability Age 35 to 64 |
| Immigrants | Spain | 99.7 /100 | #61 | Exceptional 10.0% |
| Eastern Europeans | 99.7 /100 | #62 | Exceptional 10.0% |
| Immigrants | Czechoslovakia | 99.7 /100 | #63 | Exceptional 10.0% |
| Immigrants | Romania | 99.7 /100 | #64 | Exceptional 10.0% |
| Immigrants | Poland | 99.6 /100 | #65 | Exceptional 10.0% |
| Cubans | 99.6 /100 | #66 | Exceptional 10.0% |
| Immigrants | Uzbekistan | 99.5 /100 | #67 | Exceptional 10.1% |
| Immigrants | Switzerland | 99.5 /100 | #68 | Exceptional 10.1% |
| Immigrants | Eastern Europe | 99.5 /100 | #69 | Exceptional 10.1% |
| Immigrants | Nicaragua | 99.5 /100 | #70 | Exceptional 10.1% |
| Immigrants | Kazakhstan | 99.5 /100 | #71 | Exceptional 10.1% |
| Immigrants | Northern Europe | 99.5 /100 | #72 | Exceptional 10.1% |
| Immigrants | France | 99.5 /100 | #73 | Exceptional 10.1% |
| Laotians | 99.4 /100 | #74 | Exceptional 10.1% |
| Immigrants | Latvia | 99.4 /100 | #75 | Exceptional 10.1% |
Demographics Similar to U.S. Virgin Islanders by Disability Age 35 to 64
In terms of disability age 35 to 64, the demographic groups most similar to U.S. Virgin Islanders are Pennsylvania German (12.8%, a difference of 0.080%), Celtic (12.9%, a difference of 0.11%), Nepalese (12.8%, a difference of 0.12%), Dominican (12.9%, a difference of 0.25%), and Somali (12.9%, a difference of 0.37%).
| Demographics | Rating | Rank | Disability Age 35 to 64 |
| Marshallese | 0.4 /100 | #265 | Tragic 12.5% |
| Whites/Caucasians | 0.3 /100 | #266 | Tragic 12.6% |
| Sub-Saharan Africans | 0.2 /100 | #267 | Tragic 12.6% |
| Immigrants | Dominica | 0.2 /100 | #268 | Tragic 12.7% |
| Spanish | 0.2 /100 | #269 | Tragic 12.7% |
| French | 0.2 /100 | #270 | Tragic 12.7% |
| Nepalese | 0.1 /100 | #271 | Tragic 12.8% |
| U.S. Virgin Islanders | 0.1 /100 | #272 | Tragic 12.8% |
| Pennsylvania Germans | 0.1 /100 | #273 | Tragic 12.8% |
| Celtics | 0.1 /100 | #274 | Tragic 12.9% |
| Dominicans | 0.1 /100 | #275 | Tragic 12.9% |
| Somalis | 0.1 /100 | #276 | Tragic 12.9% |
| Immigrants | Dominican Republic | 0.1 /100 | #277 | Tragic 12.9% |
| French Canadians | 0.1 /100 | #278 | Tragic 12.9% |
| Immigrants | Micronesia | 0.1 /100 | #279 | Tragic 12.9% |