Arab vs Immigrants from the Azores Disability Age 65 to 74
COMPARE
Arab
Immigrants from the Azores
Disability Age 65 to 74
Disability Age 65 to 74 Comparison
Arabs
Immigrants from the Azores
22.8%
DISABILITY AGE 65 TO 74
84.8/ 100
METRIC RATING
143rd/ 347
METRIC RANK
26.0%
DISABILITY AGE 65 TO 74
0.0/ 100
METRIC RATING
284th/ 347
METRIC RANK
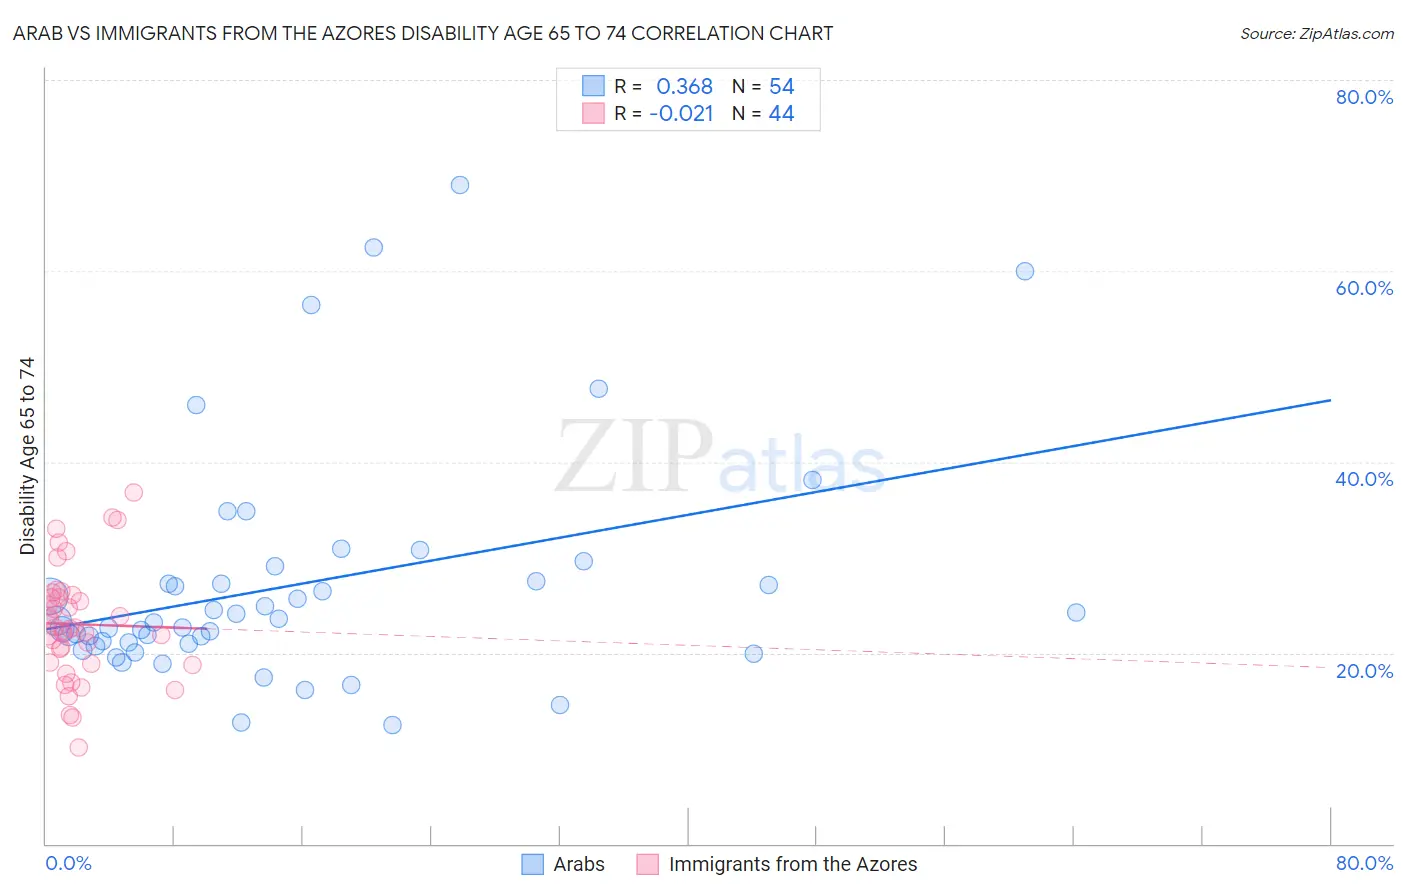
Arab vs Immigrants from the Azores Disability Age 65 to 74 Correlation Chart
The statistical analysis conducted on geographies consisting of 485,549,986 people shows a mild positive correlation between the proportion of Arabs and percentage of population with a disability between the ages 65 and 75 in the United States with a correlation coefficient (R) of 0.368 and weighted average of 22.8%. Similarly, the statistical analysis conducted on geographies consisting of 46,238,096 people shows no correlation between the proportion of Immigrants from the Azores and percentage of population with a disability between the ages 65 and 75 in the United States with a correlation coefficient (R) of -0.021 and weighted average of 26.0%, a difference of 14.2%.
Disability Age 65 to 74 Correlation Summary
| Measurement | Arab | Immigrants from the Azores |
| Minimum | 12.5% | 10.1% |
| Maximum | 69.0% | 36.7% |
| Range | 56.5% | 26.6% |
| Mean | 27.1% | 23.0% |
| Median | 23.3% | 22.6% |
| Interquartile 25% (IQ1) | 21.0% | 18.9% |
| Interquartile 75% (IQ3) | 27.5% | 25.9% |
| Interquartile Range (IQR) | 6.5% | 7.1% |
| Standard Deviation (Sample) | 12.1% | 5.8% |
| Standard Deviation (Population) | 12.0% | 5.8% |
Similar Demographics by Disability Age 65 to 74
Demographics Similar to Arabs by Disability Age 65 to 74
In terms of disability age 65 to 74, the demographic groups most similar to Arabs are Danish (22.8%, a difference of 0.040%), Immigrants from Ethiopia (22.7%, a difference of 0.060%), Belgian (22.7%, a difference of 0.070%), Ugandan (22.7%, a difference of 0.080%), and Immigrants from Uganda (22.8%, a difference of 0.080%).
| Demographics | Rating | Rank | Disability Age 65 to 74 |
| Ethiopians | 87.9 /100 | #136 | Excellent 22.7% |
| Taiwanese | 87.6 /100 | #137 | Excellent 22.7% |
| Immigrants | Moldova | 87.3 /100 | #138 | Excellent 22.7% |
| Immigrants | Syria | 85.8 /100 | #139 | Excellent 22.7% |
| Ugandans | 85.4 /100 | #140 | Excellent 22.7% |
| Belgians | 85.3 /100 | #141 | Excellent 22.7% |
| Immigrants | Ethiopia | 85.3 /100 | #142 | Excellent 22.7% |
| Arabs | 84.8 /100 | #143 | Excellent 22.8% |
| Danes | 84.4 /100 | #144 | Excellent 22.8% |
| Immigrants | Uganda | 84.0 /100 | #145 | Excellent 22.8% |
| Alsatians | 83.7 /100 | #146 | Excellent 22.8% |
| Immigrants | Uzbekistan | 83.1 /100 | #147 | Excellent 22.8% |
| New Zealanders | 79.9 /100 | #148 | Good 22.9% |
| Swiss | 79.7 /100 | #149 | Good 22.9% |
| Canadians | 77.7 /100 | #150 | Good 22.9% |
Demographics Similar to Immigrants from the Azores by Disability Age 65 to 74
In terms of disability age 65 to 74, the demographic groups most similar to Immigrants from the Azores are Immigrants from Congo (26.0%, a difference of 0.020%), Spanish American (25.9%, a difference of 0.19%), Delaware (25.9%, a difference of 0.33%), Immigrants from Honduras (25.9%, a difference of 0.40%), and Cree (25.9%, a difference of 0.42%).
| Demographics | Rating | Rank | Disability Age 65 to 74 |
| Belizeans | 0.1 /100 | #277 | Tragic 25.8% |
| Immigrants | Belize | 0.1 /100 | #278 | Tragic 25.8% |
| U.S. Virgin Islanders | 0.1 /100 | #279 | Tragic 25.9% |
| Cree | 0.1 /100 | #280 | Tragic 25.9% |
| Immigrants | Honduras | 0.1 /100 | #281 | Tragic 25.9% |
| Delaware | 0.1 /100 | #282 | Tragic 25.9% |
| Spanish Americans | 0.0 /100 | #283 | Tragic 25.9% |
| Immigrants | Azores | 0.0 /100 | #284 | Tragic 26.0% |
| Immigrants | Congo | 0.0 /100 | #285 | Tragic 26.0% |
| Immigrants | Micronesia | 0.0 /100 | #286 | Tragic 26.1% |
| Immigrants | Laos | 0.0 /100 | #287 | Tragic 26.1% |
| Mexican American Indians | 0.0 /100 | #288 | Tragic 26.2% |
| Africans | 0.0 /100 | #289 | Tragic 26.2% |
| Immigrants | Cabo Verde | 0.0 /100 | #290 | Tragic 26.3% |
| Spanish American Indians | 0.0 /100 | #291 | Tragic 26.4% |