Arab vs Immigrants from the Azores Unemployment Among Ages 30 to 34 years
COMPARE
Arab
Immigrants from the Azores
Unemployment Among Ages 30 to 34 years
Unemployment Among Ages 30 to 34 years Comparison
Arabs
Immigrants from the Azores
5.4%
UNEMPLOYMENT AMONG AGES 30 TO 34 YEARS
57.7/ 100
METRIC RATING
163rd/ 347
METRIC RANK
6.9%
UNEMPLOYMENT AMONG AGES 30 TO 34 YEARS
0.0/ 100
METRIC RATING
308th/ 347
METRIC RANK
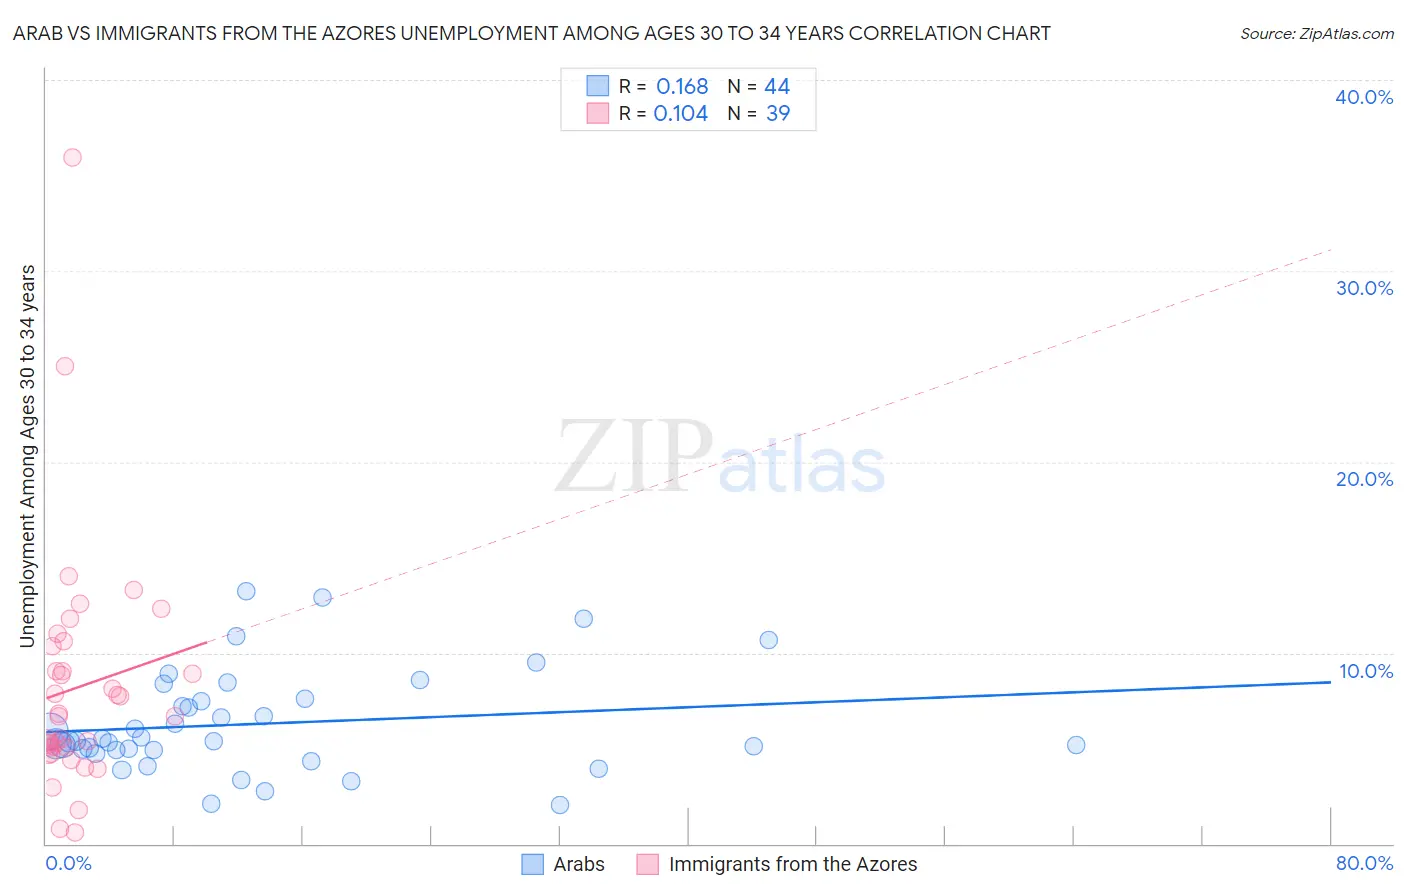
Arab vs Immigrants from the Azores Unemployment Among Ages 30 to 34 years Correlation Chart
The statistical analysis conducted on geographies consisting of 448,206,061 people shows a poor positive correlation between the proportion of Arabs and unemployment rate among population between the ages 30 and 34 in the United States with a correlation coefficient (R) of 0.168 and weighted average of 5.4%. Similarly, the statistical analysis conducted on geographies consisting of 45,190,975 people shows a poor positive correlation between the proportion of Immigrants from the Azores and unemployment rate among population between the ages 30 and 34 in the United States with a correlation coefficient (R) of 0.104 and weighted average of 6.9%, a difference of 26.8%.
Unemployment Among Ages 30 to 34 years Correlation Summary
| Measurement | Arab | Immigrants from the Azores |
| Minimum | 2.0% | 0.60% |
| Maximum | 13.2% | 36.0% |
| Range | 11.2% | 35.4% |
| Mean | 6.3% | 8.2% |
| Median | 5.4% | 6.7% |
| Interquartile 25% (IQ1) | 4.9% | 5.0% |
| Interquartile 75% (IQ3) | 7.5% | 10.3% |
| Interquartile Range (IQR) | 2.6% | 5.3% |
| Standard Deviation (Sample) | 2.7% | 6.3% |
| Standard Deviation (Population) | 2.6% | 6.3% |
Similar Demographics by Unemployment Among Ages 30 to 34 years
Demographics Similar to Arabs by Unemployment Among Ages 30 to 34 years
In terms of unemployment among ages 30 to 34 years, the demographic groups most similar to Arabs are Basque (5.4%, a difference of 0.020%), Brazilian (5.4%, a difference of 0.040%), Austrian (5.4%, a difference of 0.090%), Welsh (5.4%, a difference of 0.10%), and Immigrants from Scotland (5.4%, a difference of 0.12%).
| Demographics | Rating | Rank | Unemployment Among Ages 30 to 34 years |
| Czechoslovakians | 63.7 /100 | #156 | Good 5.4% |
| Albanians | 63.7 /100 | #157 | Good 5.4% |
| Immigrants | Belarus | 62.7 /100 | #158 | Good 5.4% |
| Immigrants | Croatia | 61.0 /100 | #159 | Good 5.4% |
| Immigrants | Scotland | 59.3 /100 | #160 | Average 5.4% |
| Austrians | 59.0 /100 | #161 | Average 5.4% |
| Brazilians | 58.2 /100 | #162 | Average 5.4% |
| Arabs | 57.7 /100 | #163 | Average 5.4% |
| Basques | 57.3 /100 | #164 | Average 5.4% |
| Welsh | 56.3 /100 | #165 | Average 5.4% |
| Immigrants | Thailand | 55.6 /100 | #166 | Average 5.4% |
| English | 54.8 /100 | #167 | Average 5.4% |
| South Americans | 52.9 /100 | #168 | Average 5.4% |
| Immigrants | Israel | 52.9 /100 | #169 | Average 5.4% |
| Dutch | 52.6 /100 | #170 | Average 5.5% |
Demographics Similar to Immigrants from the Azores by Unemployment Among Ages 30 to 34 years
In terms of unemployment among ages 30 to 34 years, the demographic groups most similar to Immigrants from the Azores are Immigrants from Belize (6.9%, a difference of 0.38%), Immigrants from Armenia (6.8%, a difference of 0.57%), Immigrants from Grenada (6.9%, a difference of 0.68%), Immigrants from St. Vincent and the Grenadines (7.0%, a difference of 1.0%), and Alaskan Athabascan (7.0%, a difference of 2.1%).
| Demographics | Rating | Rank | Unemployment Among Ages 30 to 34 years |
| Belizeans | 0.0 /100 | #301 | Tragic 6.6% |
| Delaware | 0.0 /100 | #302 | Tragic 6.7% |
| Cajuns | 0.0 /100 | #303 | Tragic 6.7% |
| Kiowa | 0.0 /100 | #304 | Tragic 6.7% |
| Paiute | 0.0 /100 | #305 | Tragic 6.7% |
| Immigrants | Armenia | 0.0 /100 | #306 | Tragic 6.8% |
| Immigrants | Belize | 0.0 /100 | #307 | Tragic 6.9% |
| Immigrants | Azores | 0.0 /100 | #308 | Tragic 6.9% |
| Immigrants | Grenada | 0.0 /100 | #309 | Tragic 6.9% |
| Immigrants | St. Vincent and the Grenadines | 0.0 /100 | #310 | Tragic 7.0% |
| Alaskan Athabascans | 0.0 /100 | #311 | Tragic 7.0% |
| British West Indians | 0.0 /100 | #312 | Tragic 7.0% |
| Ute | 0.0 /100 | #313 | Tragic 7.0% |
| Lumbee | 0.0 /100 | #314 | Tragic 7.1% |
| Aleuts | 0.0 /100 | #315 | Tragic 7.1% |