Latvian vs Immigrants from Poland Disability Age Over 75
COMPARE
Latvian
Immigrants from Poland
Disability Age Over 75
Disability Age Over 75 Comparison
Latvians
Immigrants from Poland
45.1%
DISABILITY AGE OVER 75
100.0/ 100
METRIC RATING
13th/ 347
METRIC RANK
45.4%
DISABILITY AGE OVER 75
99.9/ 100
METRIC RATING
27th/ 347
METRIC RANK
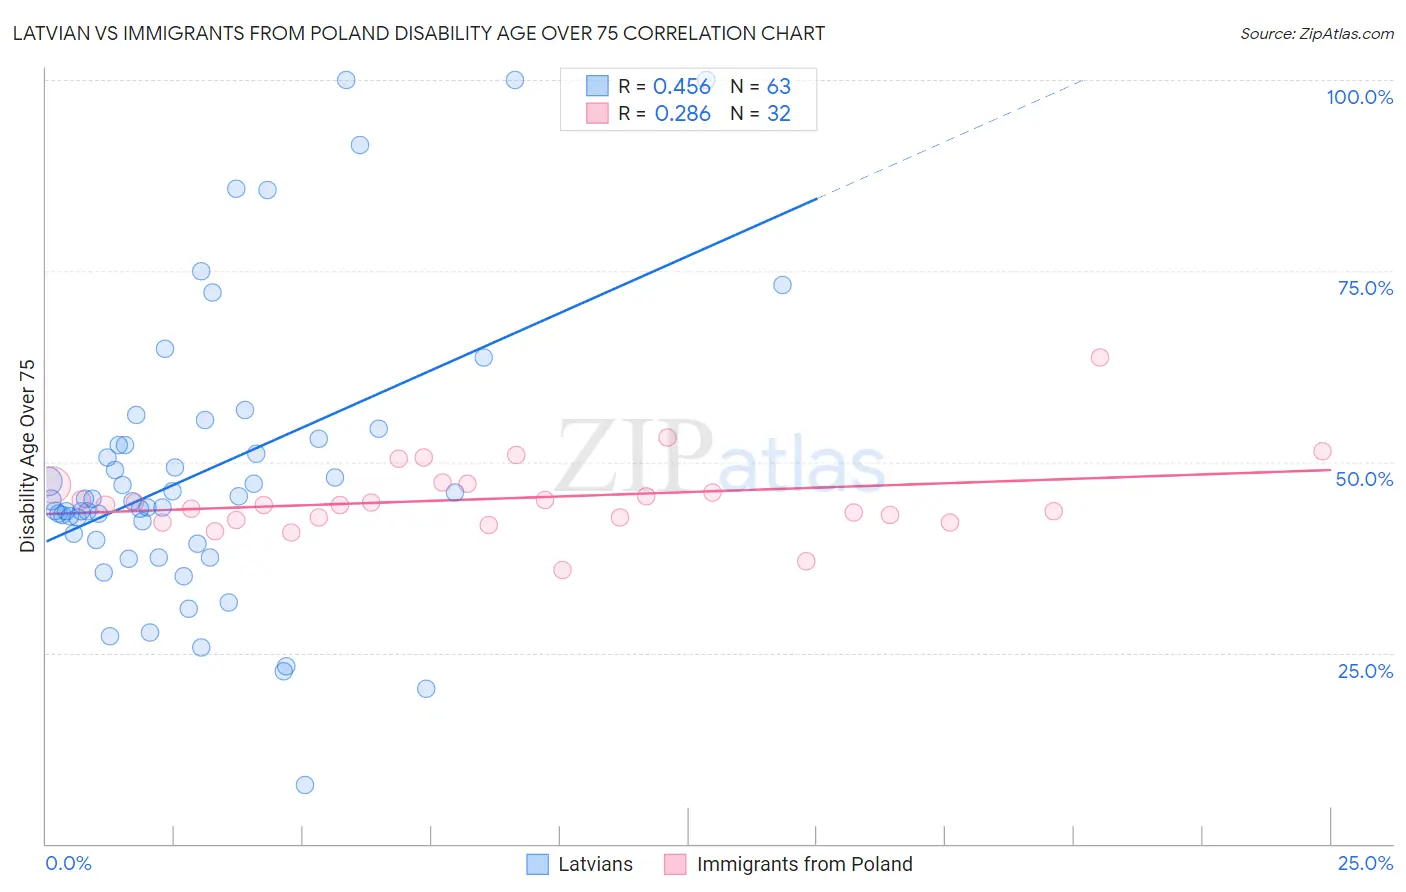
Latvian vs Immigrants from Poland Disability Age Over 75 Correlation Chart
The statistical analysis conducted on geographies consisting of 220,463,619 people shows a moderate positive correlation between the proportion of Latvians and percentage of population with a disability over the age of 75 in the United States with a correlation coefficient (R) of 0.456 and weighted average of 45.1%. Similarly, the statistical analysis conducted on geographies consisting of 304,637,447 people shows a weak positive correlation between the proportion of Immigrants from Poland and percentage of population with a disability over the age of 75 in the United States with a correlation coefficient (R) of 0.286 and weighted average of 45.4%, a difference of 0.60%.
Disability Age Over 75 Correlation Summary
| Measurement | Latvian | Immigrants from Poland |
| Minimum | 7.7% | 35.9% |
| Maximum | 100.0% | 63.6% |
| Range | 92.3% | 27.7% |
| Mean | 48.9% | 45.2% |
| Median | 44.9% | 44.4% |
| Interquartile 25% (IQ1) | 39.7% | 42.5% |
| Interquartile 75% (IQ3) | 53.1% | 47.1% |
| Interquartile Range (IQR) | 13.3% | 4.6% |
| Standard Deviation (Sample) | 19.0% | 5.1% |
| Standard Deviation (Population) | 18.8% | 5.0% |
Demographics Similar to Latvians and Immigrants from Poland by Disability Age Over 75
In terms of disability age over 75, the demographic groups most similar to Latvians are Immigrants from Czechoslovakia (45.1%, a difference of 0.010%), Immigrants from Scotland (45.1%, a difference of 0.010%), Immigrants from Sweden (45.1%, a difference of 0.050%), Lithuanian (45.1%, a difference of 0.10%), and Bulgarian (45.1%, a difference of 0.15%). Similarly, the demographic groups most similar to Immigrants from Poland are Macedonian (45.4%, a difference of 0.010%), Thai (45.4%, a difference of 0.020%), Immigrants from Bolivia (45.4%, a difference of 0.050%), Filipino (45.4%, a difference of 0.060%), and Polish (45.3%, a difference of 0.090%).
| Demographics | Rating | Rank | Disability Age Over 75 |
| Bulgarians | 100.0 /100 | #10 | Exceptional 45.1% |
| Lithuanians | 100.0 /100 | #11 | Exceptional 45.1% |
| Immigrants | Czechoslovakia | 100.0 /100 | #12 | Exceptional 45.1% |
| Latvians | 100.0 /100 | #13 | Exceptional 45.1% |
| Immigrants | Scotland | 100.0 /100 | #14 | Exceptional 45.1% |
| Immigrants | Sweden | 100.0 /100 | #15 | Exceptional 45.1% |
| Immigrants | Northern Europe | 100.0 /100 | #16 | Exceptional 45.2% |
| Immigrants | India | 100.0 /100 | #17 | Exceptional 45.2% |
| Bolivians | 100.0 /100 | #18 | Exceptional 45.2% |
| Immigrants | Greece | 100.0 /100 | #19 | Exceptional 45.2% |
| Immigrants | Serbia | 100.0 /100 | #20 | Exceptional 45.3% |
| Immigrants | Belgium | 100.0 /100 | #21 | Exceptional 45.3% |
| Immigrants | South Africa | 100.0 /100 | #22 | Exceptional 45.3% |
| Immigrants | Switzerland | 99.9 /100 | #23 | Exceptional 45.3% |
| Poles | 99.9 /100 | #24 | Exceptional 45.3% |
| Immigrants | Bolivia | 99.9 /100 | #25 | Exceptional 45.4% |
| Macedonians | 99.9 /100 | #26 | Exceptional 45.4% |
| Immigrants | Poland | 99.9 /100 | #27 | Exceptional 45.4% |
| Thais | 99.9 /100 | #28 | Exceptional 45.4% |
| Filipinos | 99.9 /100 | #29 | Exceptional 45.4% |
| Immigrants | Denmark | 99.9 /100 | #30 | Exceptional 45.4% |