Jordanian vs Immigrants from Western Europe Disability Age Over 75
COMPARE
Jordanian
Immigrants from Western Europe
Disability Age Over 75
Disability Age Over 75 Comparison
Jordanians
Immigrants from Western Europe
46.1%
DISABILITY AGE OVER 75
99.2/ 100
METRIC RATING
70th/ 347
METRIC RANK
46.2%
DISABILITY AGE OVER 75
98.8/ 100
METRIC RATING
78th/ 347
METRIC RANK
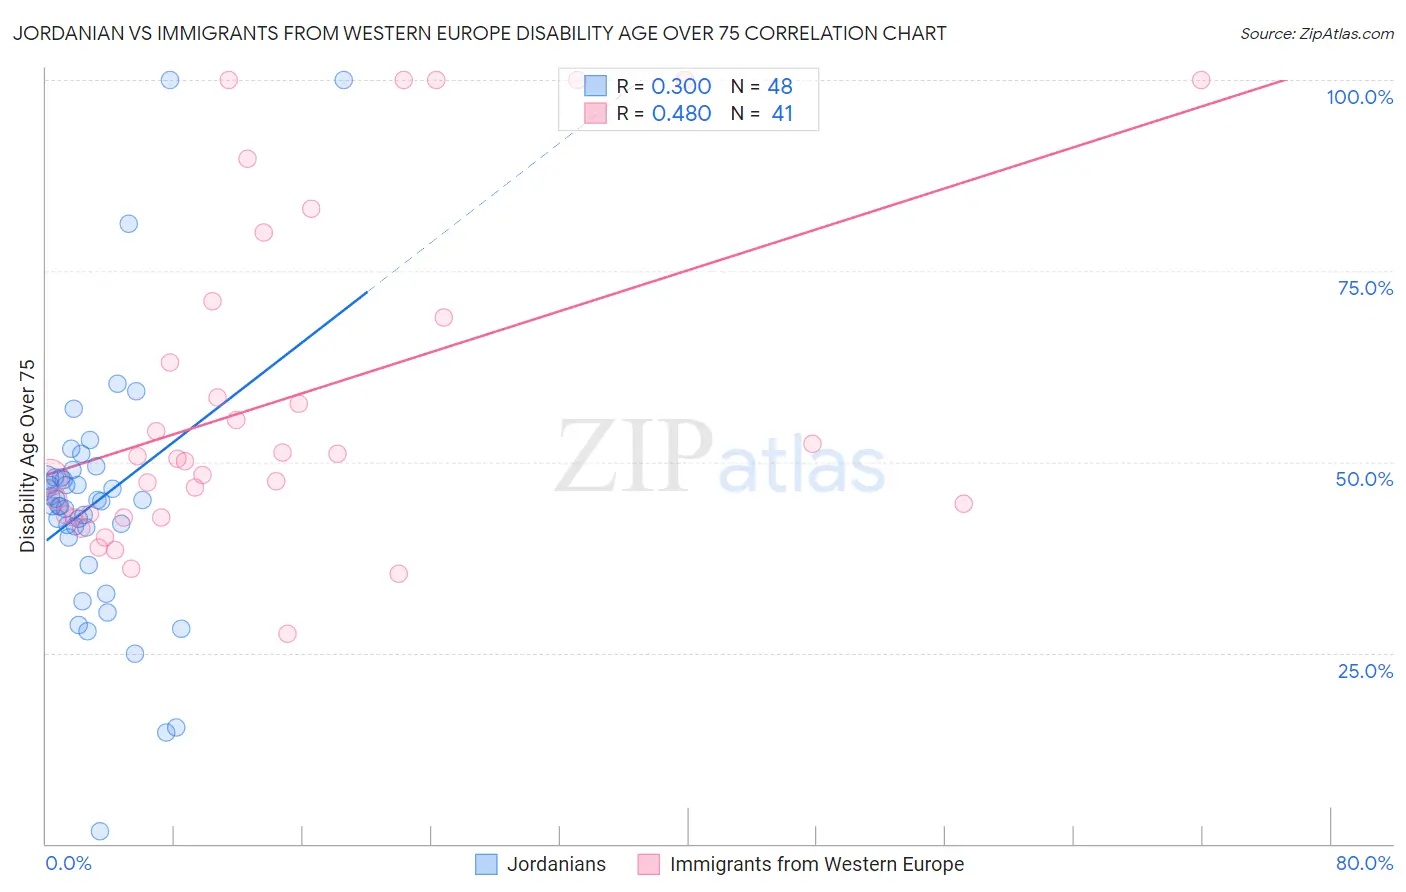
Jordanian vs Immigrants from Western Europe Disability Age Over 75 Correlation Chart
The statistical analysis conducted on geographies consisting of 166,361,859 people shows a mild positive correlation between the proportion of Jordanians and percentage of population with a disability over the age of 75 in the United States with a correlation coefficient (R) of 0.300 and weighted average of 46.1%. Similarly, the statistical analysis conducted on geographies consisting of 493,053,123 people shows a moderate positive correlation between the proportion of Immigrants from Western Europe and percentage of population with a disability over the age of 75 in the United States with a correlation coefficient (R) of 0.480 and weighted average of 46.2%, a difference of 0.23%.
Disability Age Over 75 Correlation Summary
| Measurement | Jordanian | Immigrants from Western Europe |
| Minimum | 1.6% | 27.5% |
| Maximum | 100.0% | 100.0% |
| Range | 98.4% | 72.5% |
| Mean | 44.7% | 58.2% |
| Median | 44.9% | 50.4% |
| Interquartile 25% (IQ1) | 40.8% | 42.9% |
| Interquartile 75% (IQ3) | 48.0% | 70.0% |
| Interquartile Range (IQR) | 7.2% | 27.1% |
| Standard Deviation (Sample) | 17.1% | 21.6% |
| Standard Deviation (Population) | 17.0% | 21.3% |
Demographics Similar to Jordanians and Immigrants from Western Europe by Disability Age Over 75
In terms of disability age over 75, the demographic groups most similar to Jordanians are Immigrants from Sri Lanka (46.1%, a difference of 0.030%), Immigrants from Hungary (46.1%, a difference of 0.070%), Cambodian (46.1%, a difference of 0.080%), Immigrants from Romania (46.0%, a difference of 0.10%), and Egyptian (46.1%, a difference of 0.13%). Similarly, the demographic groups most similar to Immigrants from Western Europe are Immigrants from Eastern Asia (46.2%, a difference of 0.010%), Swiss (46.2%, a difference of 0.040%), Soviet Union (46.2%, a difference of 0.040%), Slavic (46.1%, a difference of 0.050%), and New Zealander (46.2%, a difference of 0.050%).
| Demographics | Rating | Rank | Disability Age Over 75 |
| Immigrants | North Macedonia | 99.5 /100 | #64 | Exceptional 45.9% |
| Austrians | 99.5 /100 | #65 | Exceptional 46.0% |
| Immigrants | England | 99.5 /100 | #66 | Exceptional 46.0% |
| Immigrants | Spain | 99.4 /100 | #67 | Exceptional 46.0% |
| Immigrants | South Central Asia | 99.4 /100 | #68 | Exceptional 46.0% |
| Immigrants | Romania | 99.3 /100 | #69 | Exceptional 46.0% |
| Jordanians | 99.2 /100 | #70 | Exceptional 46.1% |
| Immigrants | Sri Lanka | 99.2 /100 | #71 | Exceptional 46.1% |
| Immigrants | Hungary | 99.1 /100 | #72 | Exceptional 46.1% |
| Cambodians | 99.1 /100 | #73 | Exceptional 46.1% |
| Egyptians | 99.0 /100 | #74 | Exceptional 46.1% |
| Serbians | 99.0 /100 | #75 | Exceptional 46.1% |
| Slavs | 98.9 /100 | #76 | Exceptional 46.1% |
| Immigrants | Eastern Asia | 98.9 /100 | #77 | Exceptional 46.2% |
| Immigrants | Western Europe | 98.8 /100 | #78 | Exceptional 46.2% |
| Swiss | 98.8 /100 | #79 | Exceptional 46.2% |
| Soviet Union | 98.8 /100 | #80 | Exceptional 46.2% |
| New Zealanders | 98.8 /100 | #81 | Exceptional 46.2% |
| Immigrants | Latvia | 98.7 /100 | #82 | Exceptional 46.2% |
| Argentineans | 98.7 /100 | #83 | Exceptional 46.2% |
| Immigrants | Jordan | 98.7 /100 | #84 | Exceptional 46.2% |