Aleut vs Mexican American Indian Hearing Disability
COMPARE
Aleut
Mexican American Indian
Hearing Disability
Hearing Disability Comparison
Aleuts
Mexican American Indians
4.3%
HEARING DISABILITY
0.0/ 100
METRIC RATING
334th/ 347
METRIC RANK
3.0%
HEARING DISABILITY
34.7/ 100
METRIC RATING
188th/ 347
METRIC RANK
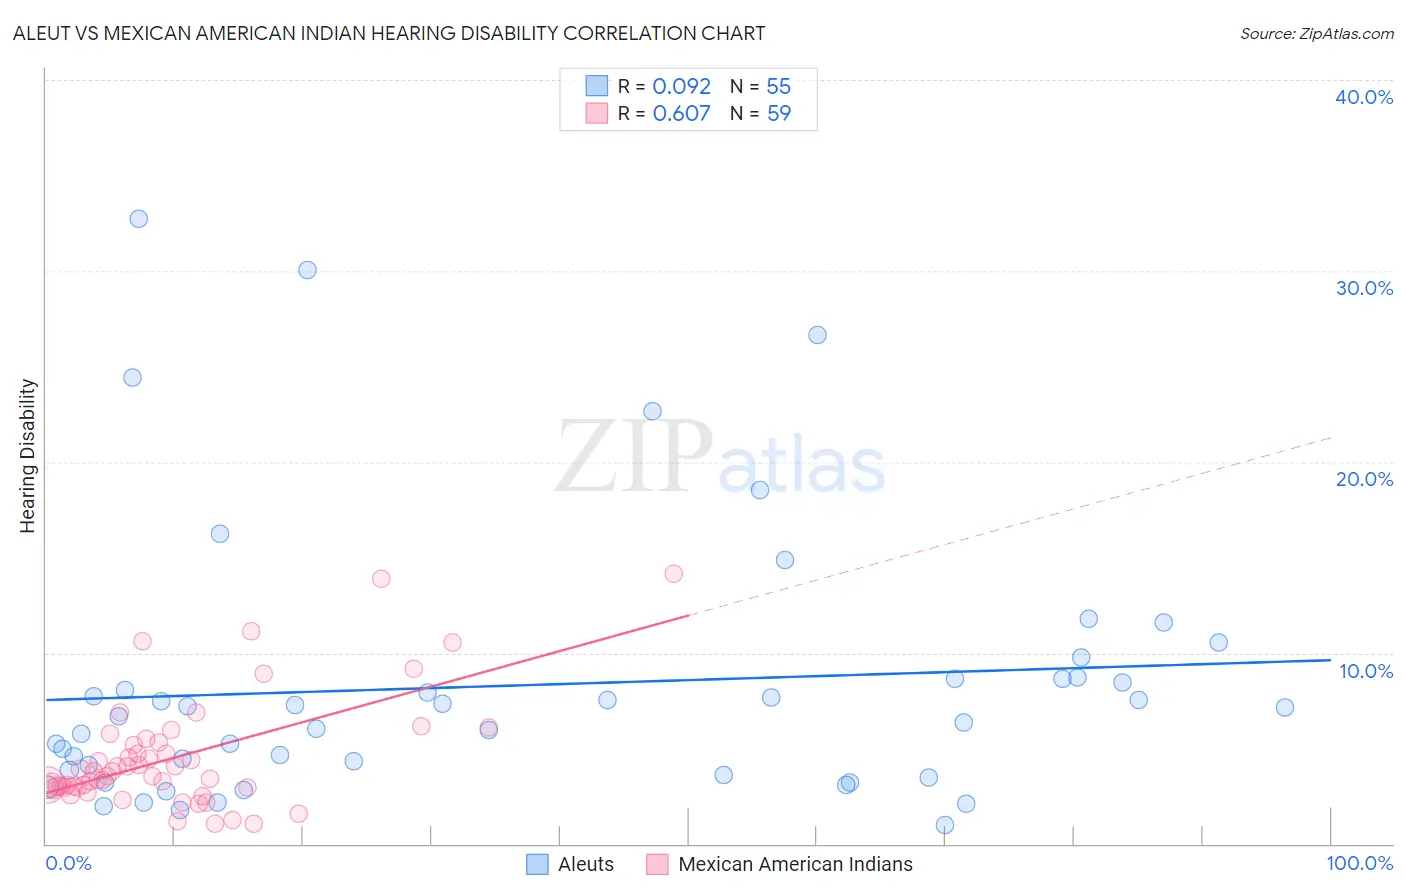
Aleut vs Mexican American Indian Hearing Disability Correlation Chart
The statistical analysis conducted on geographies consisting of 61,781,709 people shows a slight positive correlation between the proportion of Aleuts and percentage of population with hearing disability in the United States with a correlation coefficient (R) of 0.092 and weighted average of 4.3%. Similarly, the statistical analysis conducted on geographies consisting of 317,548,375 people shows a significant positive correlation between the proportion of Mexican American Indians and percentage of population with hearing disability in the United States with a correlation coefficient (R) of 0.607 and weighted average of 3.0%, a difference of 40.8%.
Hearing Disability Correlation Summary
| Measurement | Aleut | Mexican American Indian |
| Minimum | 0.97% | 1.0% |
| Maximum | 32.7% | 14.2% |
| Range | 31.7% | 13.2% |
| Mean | 8.3% | 4.5% |
| Median | 6.7% | 3.6% |
| Interquartile 25% (IQ1) | 3.6% | 2.9% |
| Interquartile 75% (IQ3) | 8.6% | 5.3% |
| Interquartile Range (IQR) | 5.0% | 2.3% |
| Standard Deviation (Sample) | 7.1% | 2.9% |
| Standard Deviation (Population) | 7.1% | 2.9% |
Similar Demographics by Hearing Disability
Demographics Similar to Aleuts by Hearing Disability
In terms of hearing disability, the demographic groups most similar to Aleuts are Dutch West Indian (4.3%, a difference of 0.54%), Houma (4.2%, a difference of 1.1%), Kiowa (4.3%, a difference of 1.3%), Cherokee (4.2%, a difference of 1.8%), and Native/Alaskan (4.2%, a difference of 2.0%).
| Demographics | Rating | Rank | Hearing Disability |
| Arapaho | 0.0 /100 | #327 | Tragic 4.1% |
| Tohono O'odham | 0.0 /100 | #328 | Tragic 4.2% |
| Crow | 0.0 /100 | #329 | Tragic 4.2% |
| Natives/Alaskans | 0.0 /100 | #330 | Tragic 4.2% |
| Cherokee | 0.0 /100 | #331 | Tragic 4.2% |
| Houma | 0.0 /100 | #332 | Tragic 4.2% |
| Dutch West Indians | 0.0 /100 | #333 | Tragic 4.3% |
| Aleuts | 0.0 /100 | #334 | Tragic 4.3% |
| Kiowa | 0.0 /100 | #335 | Tragic 4.3% |
| Creek | 0.0 /100 | #336 | Tragic 4.4% |
| Chickasaw | 0.0 /100 | #337 | Tragic 4.5% |
| Alaska Natives | 0.0 /100 | #338 | Tragic 4.5% |
| Choctaw | 0.0 /100 | #339 | Tragic 4.5% |
| Pueblo | 0.0 /100 | #340 | Tragic 4.6% |
| Navajo | 0.0 /100 | #341 | Tragic 4.6% |
Demographics Similar to Mexican American Indians by Hearing Disability
In terms of hearing disability, the demographic groups most similar to Mexican American Indians are Black/African American (3.0%, a difference of 0.010%), Immigrants from Mexico (3.0%, a difference of 0.020%), Immigrants from Southern Europe (3.0%, a difference of 0.070%), African (3.0%, a difference of 0.19%), and Immigrants from Ireland (3.0%, a difference of 0.27%).
| Demographics | Rating | Rank | Hearing Disability |
| Immigrants | Belgium | 41.5 /100 | #181 | Average 3.0% |
| Immigrants | Italy | 41.1 /100 | #182 | Average 3.0% |
| Bulgarians | 39.7 /100 | #183 | Fair 3.0% |
| Immigrants | Ireland | 37.4 /100 | #184 | Fair 3.0% |
| Immigrants | Southern Europe | 35.3 /100 | #185 | Fair 3.0% |
| Immigrants | Mexico | 34.9 /100 | #186 | Fair 3.0% |
| Blacks/African Americans | 34.7 /100 | #187 | Fair 3.0% |
| Mexican American Indians | 34.7 /100 | #188 | Fair 3.0% |
| Africans | 32.9 /100 | #189 | Fair 3.0% |
| Immigrants | South Africa | 31.1 /100 | #190 | Fair 3.1% |
| Immigrants | Switzerland | 28.8 /100 | #191 | Fair 3.1% |
| Koreans | 27.6 /100 | #192 | Fair 3.1% |
| Macedonians | 27.0 /100 | #193 | Fair 3.1% |
| South Africans | 24.5 /100 | #194 | Fair 3.1% |
| Spanish American Indians | 24.1 /100 | #195 | Fair 3.1% |