Aleut vs Canadian 10th Grade
COMPARE
Aleut
Canadian
10th Grade
10th Grade Comparison
Aleuts
Canadians
95.0%
10TH GRADE
99.8/ 100
METRIC RATING
58th/ 347
METRIC RANK
94.9%
10TH GRADE
99.6/ 100
METRIC RATING
74th/ 347
METRIC RANK
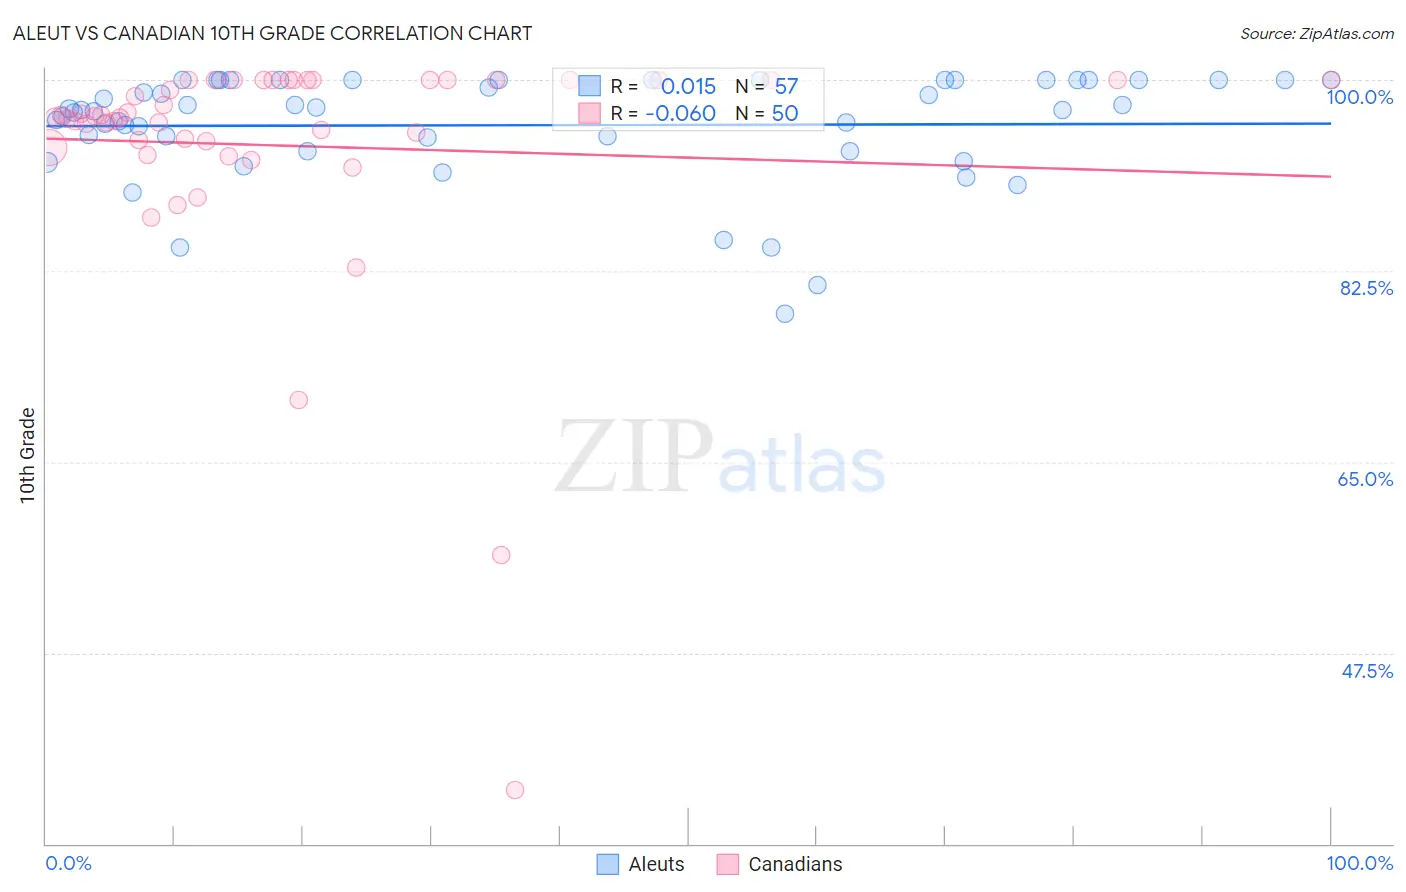
Aleut vs Canadian 10th Grade Correlation Chart
The statistical analysis conducted on geographies consisting of 61,782,736 people shows no correlation between the proportion of Aleuts and percentage of population with at least 10th grade education in the United States with a correlation coefficient (R) of 0.015 and weighted average of 95.0%. Similarly, the statistical analysis conducted on geographies consisting of 437,556,598 people shows a slight negative correlation between the proportion of Canadians and percentage of population with at least 10th grade education in the United States with a correlation coefficient (R) of -0.060 and weighted average of 94.9%, a difference of 0.15%.
10th Grade Correlation Summary
| Measurement | Aleut | Canadian |
| Minimum | 78.6% | 34.9% |
| Maximum | 100.0% | 100.0% |
| Range | 21.4% | 65.1% |
| Mean | 95.9% | 94.0% |
| Median | 97.3% | 96.6% |
| Interquartile 25% (IQ1) | 94.1% | 94.4% |
| Interquartile 75% (IQ3) | 100.0% | 100.0% |
| Interquartile Range (IQR) | 5.9% | 5.6% |
| Standard Deviation (Sample) | 5.0% | 11.5% |
| Standard Deviation (Population) | 5.0% | 11.3% |
Demographics Similar to Aleuts and Canadians by 10th Grade
In terms of 10th grade, the demographic groups most similar to Aleuts are Ukrainian (95.0%, a difference of 0.0%), Celtic (95.0%, a difference of 0.0%), New Zealander (95.0%, a difference of 0.010%), Cypriot (95.0%, a difference of 0.010%), and Chippewa (95.0%, a difference of 0.010%). Similarly, the demographic groups most similar to Canadians are Bhutanese (94.9%, a difference of 0.0%), Immigrants from Sweden (94.9%, a difference of 0.010%), Alaska Native (94.9%, a difference of 0.020%), Zimbabwean (94.9%, a difference of 0.030%), and Okinawan (94.8%, a difference of 0.030%).
| Demographics | Rating | Rank | 10th Grade |
| New Zealanders | 99.8 /100 | #56 | Exceptional 95.0% |
| Ukrainians | 99.8 /100 | #57 | Exceptional 95.0% |
| Aleuts | 99.8 /100 | #58 | Exceptional 95.0% |
| Celtics | 99.8 /100 | #59 | Exceptional 95.0% |
| Cypriots | 99.8 /100 | #60 | Exceptional 95.0% |
| Chippewa | 99.8 /100 | #61 | Exceptional 95.0% |
| Thais | 99.8 /100 | #62 | Exceptional 95.0% |
| Immigrants | Singapore | 99.8 /100 | #63 | Exceptional 95.0% |
| Native Hawaiians | 99.7 /100 | #64 | Exceptional 95.0% |
| Turks | 99.7 /100 | #65 | Exceptional 95.0% |
| Immigrants | Australia | 99.7 /100 | #66 | Exceptional 94.9% |
| Immigrants | Netherlands | 99.7 /100 | #67 | Exceptional 94.9% |
| Immigrants | Belgium | 99.7 /100 | #68 | Exceptional 94.9% |
| Immigrants | England | 99.6 /100 | #69 | Exceptional 94.9% |
| Zimbabweans | 99.6 /100 | #70 | Exceptional 94.9% |
| Alaska Natives | 99.6 /100 | #71 | Exceptional 94.9% |
| Immigrants | Sweden | 99.6 /100 | #72 | Exceptional 94.9% |
| Bhutanese | 99.6 /100 | #73 | Exceptional 94.9% |
| Canadians | 99.6 /100 | #74 | Exceptional 94.9% |
| Okinawans | 99.5 /100 | #75 | Exceptional 94.8% |
| Romanians | 99.5 /100 | #76 | Exceptional 94.8% |