Serbian vs Ugandan Disability Age Over 75
COMPARE
Serbian
Ugandan
Disability Age Over 75
Disability Age Over 75 Comparison
Serbians
Ugandans
46.1%
DISABILITY AGE OVER 75
99.0/ 100
METRIC RATING
75th/ 347
METRIC RANK
46.3%
DISABILITY AGE OVER 75
98.2/ 100
METRIC RATING
93rd/ 347
METRIC RANK
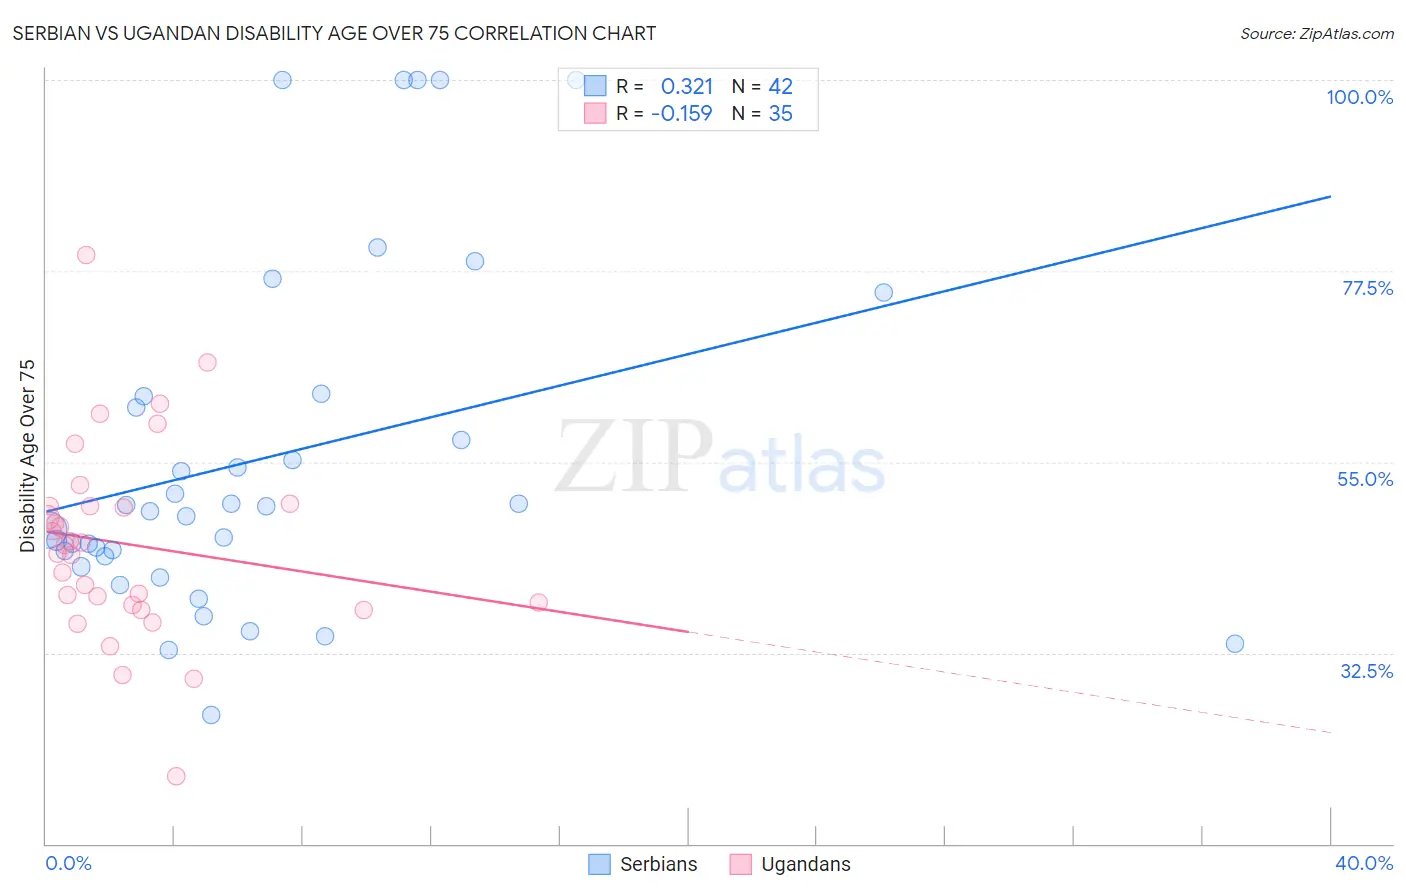
Serbian vs Ugandan Disability Age Over 75 Correlation Chart
The statistical analysis conducted on geographies consisting of 267,445,172 people shows a mild positive correlation between the proportion of Serbians and percentage of population with a disability over the age of 75 in the United States with a correlation coefficient (R) of 0.321 and weighted average of 46.1%. Similarly, the statistical analysis conducted on geographies consisting of 93,983,059 people shows a poor negative correlation between the proportion of Ugandans and percentage of population with a disability over the age of 75 in the United States with a correlation coefficient (R) of -0.159 and weighted average of 46.3%, a difference of 0.33%.
Disability Age Over 75 Correlation Summary
| Measurement | Serbian | Ugandan |
| Minimum | 25.2% | 17.9% |
| Maximum | 100.0% | 79.3% |
| Range | 74.8% | 61.4% |
| Mean | 55.6% | 45.3% |
| Median | 49.4% | 45.3% |
| Interquartile 25% (IQ1) | 43.9% | 38.1% |
| Interquartile 75% (IQ3) | 62.7% | 49.8% |
| Interquartile Range (IQR) | 18.8% | 11.7% |
| Standard Deviation (Sample) | 20.5% | 11.6% |
| Standard Deviation (Population) | 20.2% | 11.4% |
Demographics Similar to Serbians and Ugandans by Disability Age Over 75
In terms of disability age over 75, the demographic groups most similar to Serbians are Slavic (46.1%, a difference of 0.010%), Egyptian (46.1%, a difference of 0.040%), Immigrants from Eastern Asia (46.2%, a difference of 0.050%), Immigrants from Western Europe (46.2%, a difference of 0.060%), and Swiss (46.2%, a difference of 0.10%). Similarly, the demographic groups most similar to Ugandans are German (46.3%, a difference of 0.0%), Albanian (46.3%, a difference of 0.030%), Immigrants from Egypt (46.3%, a difference of 0.050%), Northern European (46.3%, a difference of 0.060%), and Immigrants from Saudi Arabia (46.3%, a difference of 0.070%).
| Demographics | Rating | Rank | Disability Age Over 75 |
| Egyptians | 99.0 /100 | #74 | Exceptional 46.1% |
| Serbians | 99.0 /100 | #75 | Exceptional 46.1% |
| Slavs | 98.9 /100 | #76 | Exceptional 46.1% |
| Immigrants | Eastern Asia | 98.9 /100 | #77 | Exceptional 46.2% |
| Immigrants | Western Europe | 98.8 /100 | #78 | Exceptional 46.2% |
| Swiss | 98.8 /100 | #79 | Exceptional 46.2% |
| Soviet Union | 98.8 /100 | #80 | Exceptional 46.2% |
| New Zealanders | 98.8 /100 | #81 | Exceptional 46.2% |
| Immigrants | Latvia | 98.7 /100 | #82 | Exceptional 46.2% |
| Argentineans | 98.7 /100 | #83 | Exceptional 46.2% |
| Immigrants | Jordan | 98.7 /100 | #84 | Exceptional 46.2% |
| Immigrants | Southern Europe | 98.6 /100 | #85 | Exceptional 46.2% |
| Romanians | 98.6 /100 | #86 | Exceptional 46.2% |
| Danes | 98.6 /100 | #87 | Exceptional 46.2% |
| Uruguayans | 98.4 /100 | #88 | Exceptional 46.2% |
| Immigrants | Saudi Arabia | 98.4 /100 | #89 | Exceptional 46.3% |
| Northern Europeans | 98.3 /100 | #90 | Exceptional 46.3% |
| Immigrants | Egypt | 98.3 /100 | #91 | Exceptional 46.3% |
| Germans | 98.2 /100 | #92 | Exceptional 46.3% |
| Ugandans | 98.2 /100 | #93 | Exceptional 46.3% |
| Albanians | 98.1 /100 | #94 | Exceptional 46.3% |