African vs Cajun Cognitive Disability
COMPARE
African
Cajun
Cognitive Disability
Cognitive Disability Comparison
Africans
Cajuns
18.6%
COGNITIVE DISABILITY
0.0/ 100
METRIC RATING
321st/ 347
METRIC RANK
17.8%
COGNITIVE DISABILITY
1.4/ 100
METRIC RATING
239th/ 347
METRIC RANK
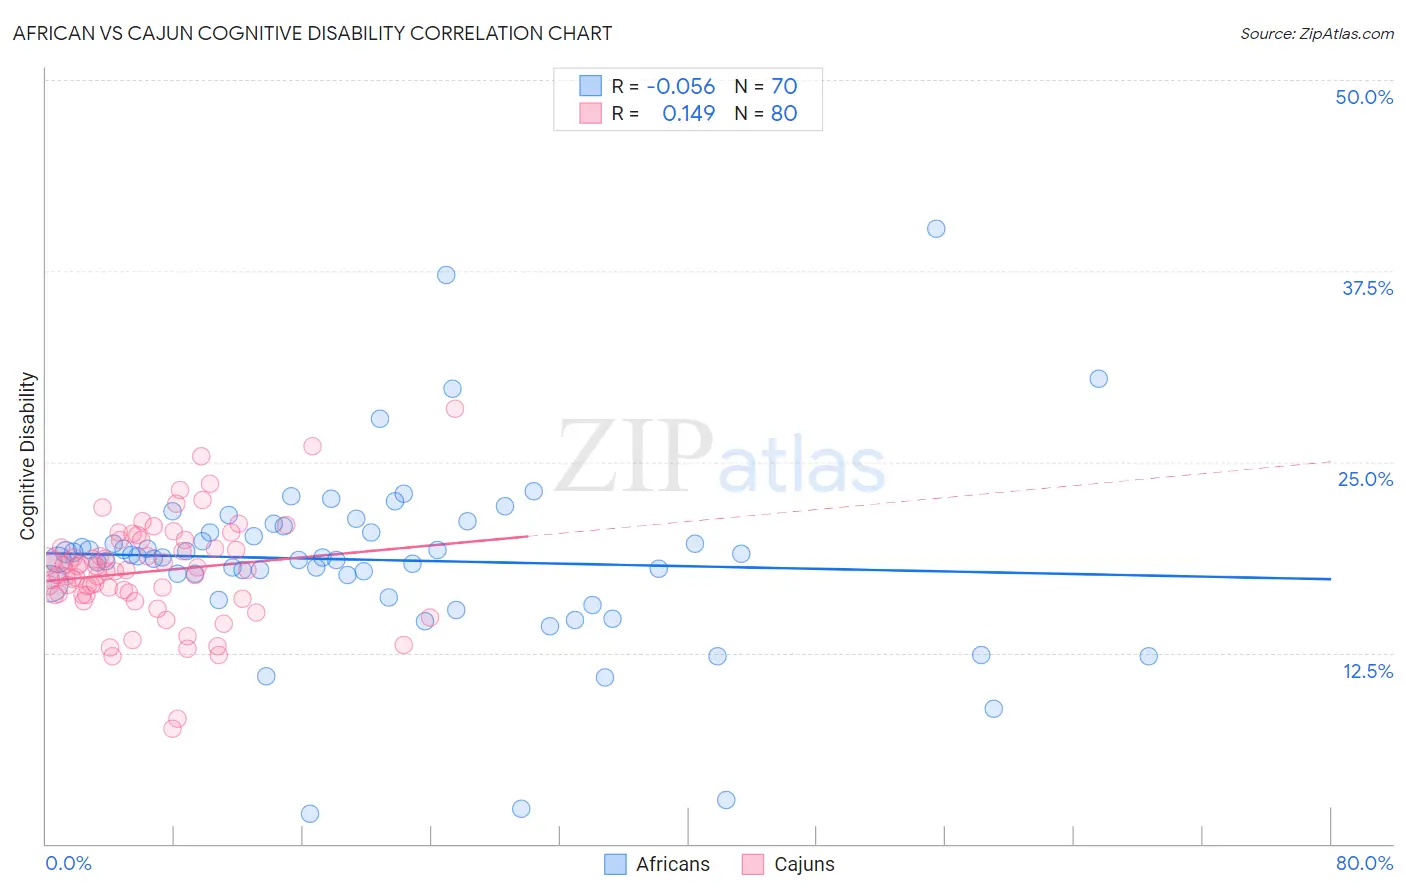
African vs Cajun Cognitive Disability Correlation Chart
The statistical analysis conducted on geographies consisting of 469,983,328 people shows a slight negative correlation between the proportion of Africans and percentage of population with cognitive disability in the United States with a correlation coefficient (R) of -0.056 and weighted average of 18.6%. Similarly, the statistical analysis conducted on geographies consisting of 149,701,580 people shows a poor positive correlation between the proportion of Cajuns and percentage of population with cognitive disability in the United States with a correlation coefficient (R) of 0.149 and weighted average of 17.8%, a difference of 4.8%.
Cognitive Disability Correlation Summary
| Measurement | African | Cajun |
| Minimum | 2.0% | 7.5% |
| Maximum | 40.3% | 28.5% |
| Range | 38.3% | 20.9% |
| Mean | 18.6% | 17.8% |
| Median | 18.8% | 17.9% |
| Interquartile 25% (IQ1) | 17.0% | 16.3% |
| Interquartile 75% (IQ3) | 20.4% | 19.6% |
| Interquartile Range (IQR) | 3.4% | 3.4% |
| Standard Deviation (Sample) | 6.1% | 3.4% |
| Standard Deviation (Population) | 6.0% | 3.4% |
Similar Demographics by Cognitive Disability
Demographics Similar to Africans by Cognitive Disability
In terms of cognitive disability, the demographic groups most similar to Africans are Immigrants from Liberia (18.7%, a difference of 0.060%), Pueblo (18.7%, a difference of 0.080%), Apache (18.6%, a difference of 0.090%), Comanche (18.6%, a difference of 0.13%), and Bangladeshi (18.6%, a difference of 0.17%).
| Demographics | Rating | Rank | Cognitive Disability |
| Sub-Saharan Africans | 0.0 /100 | #314 | Tragic 18.5% |
| Immigrants | Dominica | 0.0 /100 | #315 | Tragic 18.6% |
| Immigrants | Middle Africa | 0.0 /100 | #316 | Tragic 18.6% |
| Liberians | 0.0 /100 | #317 | Tragic 18.6% |
| Bangladeshis | 0.0 /100 | #318 | Tragic 18.6% |
| Comanche | 0.0 /100 | #319 | Tragic 18.6% |
| Apache | 0.0 /100 | #320 | Tragic 18.6% |
| Africans | 0.0 /100 | #321 | Tragic 18.6% |
| Immigrants | Liberia | 0.0 /100 | #322 | Tragic 18.7% |
| Pueblo | 0.0 /100 | #323 | Tragic 18.7% |
| Dominicans | 0.0 /100 | #324 | Tragic 18.7% |
| Indonesians | 0.0 /100 | #325 | Tragic 18.7% |
| Immigrants | Senegal | 0.0 /100 | #326 | Tragic 18.7% |
| U.S. Virgin Islanders | 0.0 /100 | #327 | Tragic 18.7% |
| Kiowa | 0.0 /100 | #328 | Tragic 18.7% |
Demographics Similar to Cajuns by Cognitive Disability
In terms of cognitive disability, the demographic groups most similar to Cajuns are Iraqi (17.8%, a difference of 0.040%), Cheyenne (17.8%, a difference of 0.13%), Immigrants from Mexico (17.8%, a difference of 0.16%), Immigrants from Iraq (17.8%, a difference of 0.17%), and Mexican (17.8%, a difference of 0.18%).
| Demographics | Rating | Rank | Cognitive Disability |
| Tongans | 2.1 /100 | #232 | Tragic 17.8% |
| Panamanians | 2.1 /100 | #233 | Tragic 17.8% |
| Osage | 2.0 /100 | #234 | Tragic 17.8% |
| Spanish American Indians | 2.0 /100 | #235 | Tragic 17.8% |
| Immigrants | Iraq | 1.8 /100 | #236 | Tragic 17.8% |
| Immigrants | Mexico | 1.8 /100 | #237 | Tragic 17.8% |
| Cheyenne | 1.7 /100 | #238 | Tragic 17.8% |
| Cajuns | 1.4 /100 | #239 | Tragic 17.8% |
| Iraqis | 1.4 /100 | #240 | Tragic 17.8% |
| Mexicans | 1.1 /100 | #241 | Tragic 17.8% |
| Paiute | 1.1 /100 | #242 | Tragic 17.8% |
| Immigrants | Bangladesh | 1.0 /100 | #243 | Tragic 17.8% |
| Jamaicans | 0.9 /100 | #244 | Tragic 17.9% |
| Trinidadians and Tobagonians | 0.8 /100 | #245 | Tragic 17.9% |
| Immigrants | Thailand | 0.8 /100 | #246 | Tragic 17.9% |