Yup'ik vs Jordanian Cognitive Disability
COMPARE
Yup'ik
Jordanian
Cognitive Disability
Cognitive Disability Comparison
Yup'ik
Jordanians
16.9%
COGNITIVE DISABILITY
96.9/ 100
METRIC RATING
115th/ 347
METRIC RANK
16.8%
COGNITIVE DISABILITY
98.2/ 100
METRIC RATING
99th/ 347
METRIC RANK
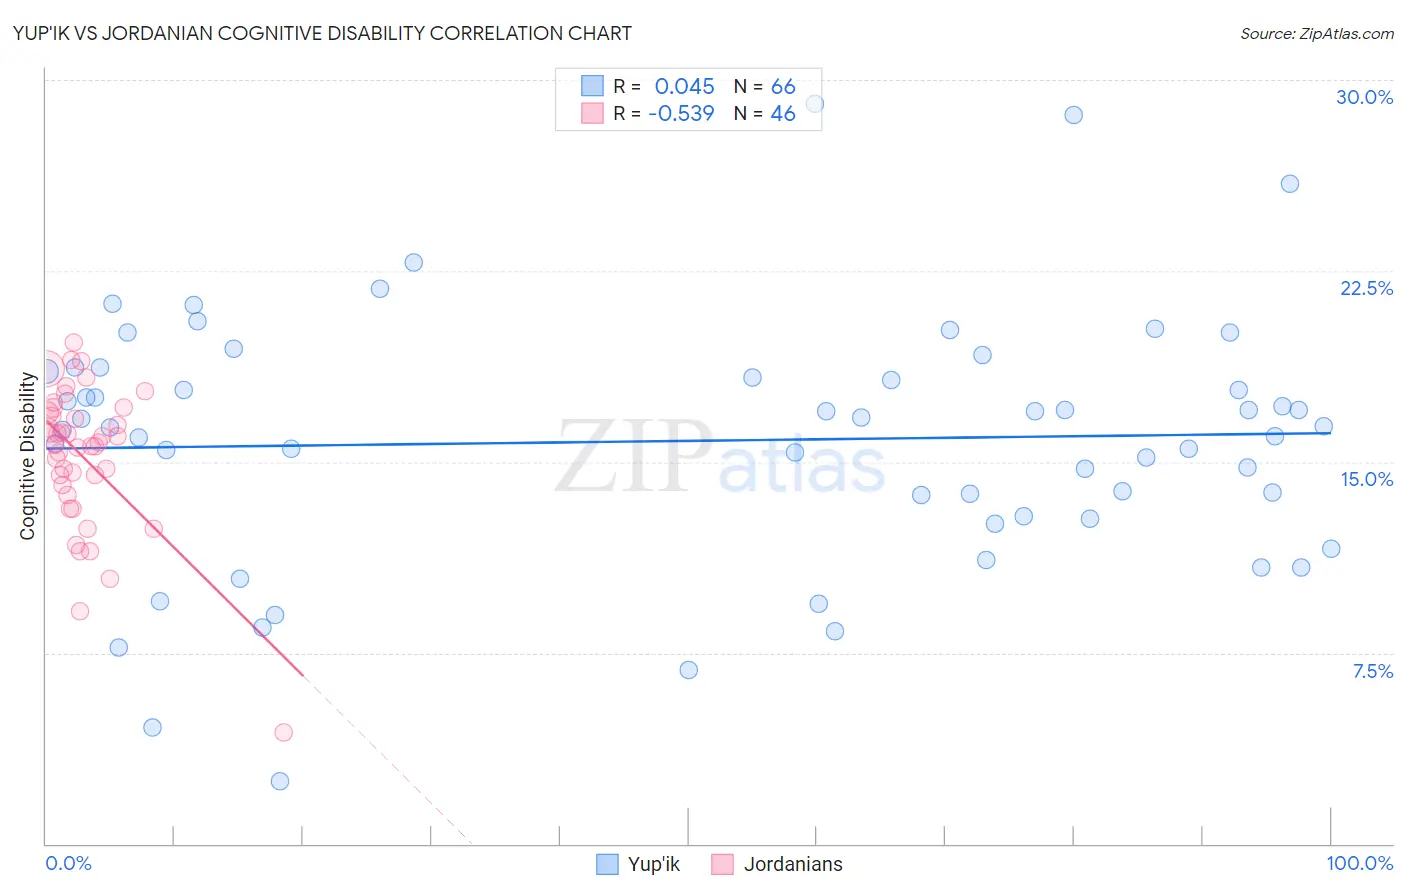
Yup'ik vs Jordanian Cognitive Disability Correlation Chart
The statistical analysis conducted on geographies consisting of 39,961,414 people shows no correlation between the proportion of Yup'ik and percentage of population with cognitive disability in the United States with a correlation coefficient (R) of 0.045 and weighted average of 16.9%. Similarly, the statistical analysis conducted on geographies consisting of 166,416,373 people shows a substantial negative correlation between the proportion of Jordanians and percentage of population with cognitive disability in the United States with a correlation coefficient (R) of -0.539 and weighted average of 16.8%, a difference of 0.42%.
Cognitive Disability Correlation Summary
| Measurement | Yup'ik | Jordanian |
| Minimum | 2.5% | 4.3% |
| Maximum | 29.1% | 19.7% |
| Range | 26.6% | 15.3% |
| Mean | 15.8% | 15.2% |
| Median | 16.4% | 15.7% |
| Interquartile 25% (IQ1) | 12.9% | 14.1% |
| Interquartile 75% (IQ3) | 18.5% | 16.9% |
| Interquartile Range (IQR) | 5.7% | 2.8% |
| Standard Deviation (Sample) | 5.0% | 2.9% |
| Standard Deviation (Population) | 5.0% | 2.8% |
Demographics Similar to Yup'ik and Jordanians by Cognitive Disability
In terms of cognitive disability, the demographic groups most similar to Yup'ik are Korean (16.8%, a difference of 0.050%), Indian (Asian) (16.8%, a difference of 0.060%), Immigrants from Sri Lanka (16.8%, a difference of 0.060%), Uruguayan (16.8%, a difference of 0.080%), and Arapaho (16.8%, a difference of 0.090%). Similarly, the demographic groups most similar to Jordanians are Immigrants from Russia (16.8%, a difference of 0.030%), Immigrants from Asia (16.8%, a difference of 0.040%), Irish (16.8%, a difference of 0.060%), Immigrants from Lebanon (16.8%, a difference of 0.090%), and Dutch (16.8%, a difference of 0.11%).
| Demographics | Rating | Rank | Cognitive Disability |
| Dutch | 98.5 /100 | #97 | Exceptional 16.8% |
| Immigrants | Lebanon | 98.4 /100 | #98 | Exceptional 16.8% |
| Jordanians | 98.2 /100 | #99 | Exceptional 16.8% |
| Immigrants | Russia | 98.2 /100 | #100 | Exceptional 16.8% |
| Immigrants | Asia | 98.1 /100 | #101 | Exceptional 16.8% |
| Irish | 98.1 /100 | #102 | Exceptional 16.8% |
| Paraguayans | 98.0 /100 | #103 | Exceptional 16.8% |
| Palestinians | 98.0 /100 | #104 | Exceptional 16.8% |
| Immigrants | Eastern Asia | 97.9 /100 | #105 | Exceptional 16.8% |
| Northern Europeans | 97.8 /100 | #106 | Exceptional 16.8% |
| Immigrants | Nicaragua | 97.8 /100 | #107 | Exceptional 16.8% |
| Canadians | 97.5 /100 | #108 | Exceptional 16.8% |
| Albanians | 97.3 /100 | #109 | Exceptional 16.8% |
| Arapaho | 97.3 /100 | #110 | Exceptional 16.8% |
| Uruguayans | 97.2 /100 | #111 | Exceptional 16.8% |
| Indians (Asian) | 97.2 /100 | #112 | Exceptional 16.8% |
| Immigrants | Sri Lanka | 97.1 /100 | #113 | Exceptional 16.8% |
| Koreans | 97.1 /100 | #114 | Exceptional 16.8% |
| Yup'ik | 96.9 /100 | #115 | Exceptional 16.9% |
| Inupiat | 96.5 /100 | #116 | Exceptional 16.9% |
| Immigrants | Japan | 96.2 /100 | #117 | Exceptional 16.9% |