Zip Codes with the Highest Percentage of Population Employed in Office & Administration in Arvada, CO
RELATED REPORTS & OPTIONS
Office & Administration
Arvada
Compare Zip Codes
Map of Zip Codes with the Highest Percentage of Population Employed in Office & Administration in Arvada
9.4%
12.9%
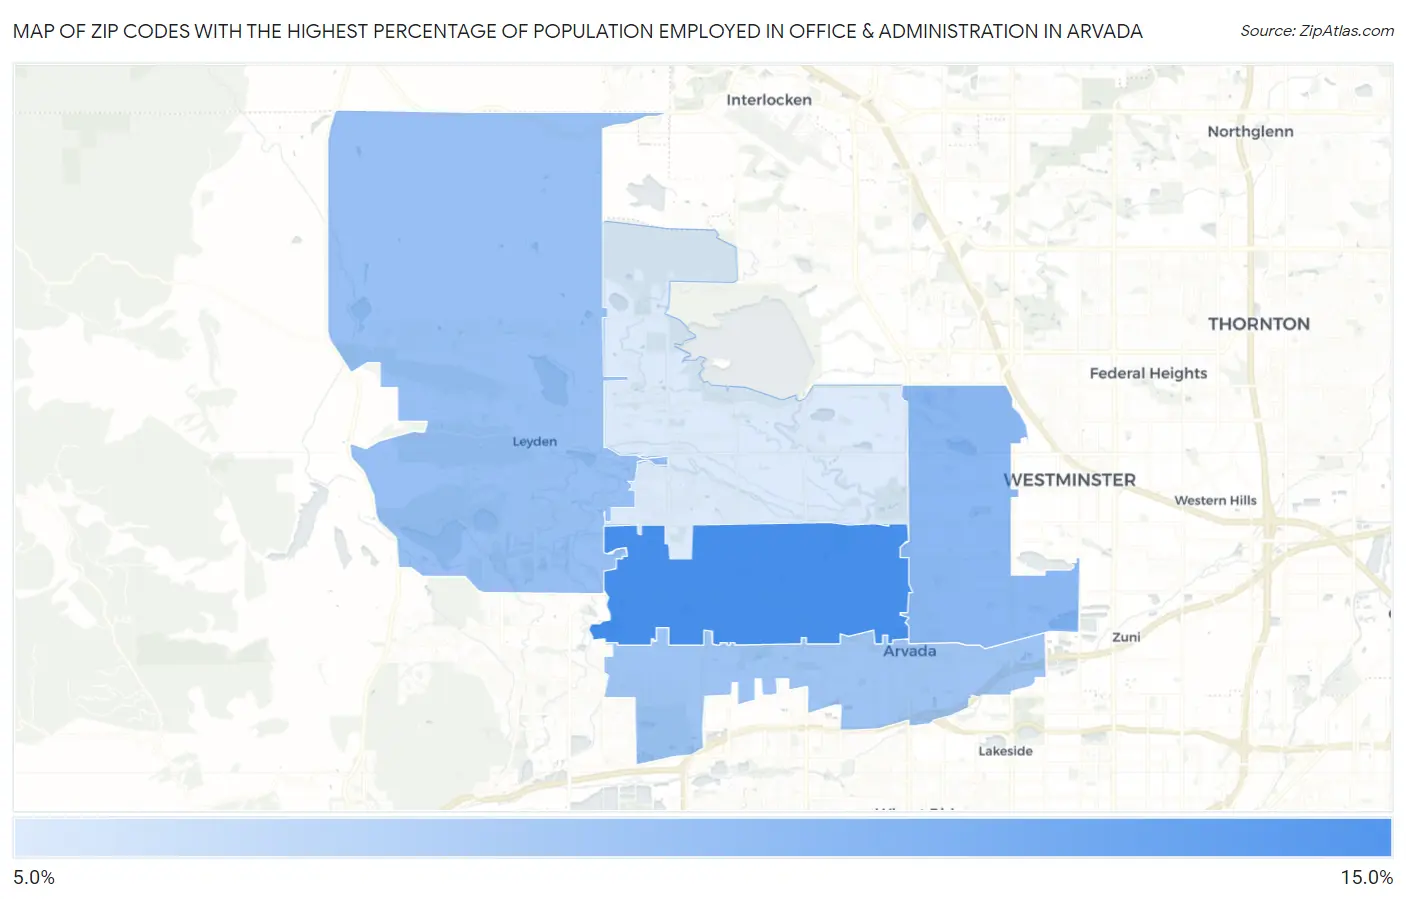
Zip Codes with the Highest Percentage of Population Employed in Office & Administration in Arvada, CO
| Zip Code | % Employed | vs State | vs National | |
| 1. | 80004 | 12.9% | 10.1%(+2.73)#110 | 10.9%(+2.01)#8,398 |
| 2. | 80003 | 11.3% | 10.1%(+1.17)#155 | 10.9%(+0.440)#12,889 |
| 3. | 80007 | 11.0% | 10.1%(+0.835)#171 | 10.9%(+0.109)#13,949 |
| 4. | 80002 | 10.8% | 10.1%(+0.683)#180 | 10.9%(-0.043)#14,460 |
| 5. | 80005 | 9.4% | 10.1%(-0.763)#254 | 10.9%(-1.49)#19,189 |
1
Common Questions
What are the Top 3 Zip Codes with the Highest Percentage of Population Employed in Office & Administration in Arvada, CO?
Top 3 Zip Codes with the Highest Percentage of Population Employed in Office & Administration in Arvada, CO are:
What zip code has the Highest Percentage of Population Employed in Office & Administration in Arvada, CO?
80004 has the Highest Percentage of Population Employed in Office & Administration in Arvada, CO with 12.9%.
What is the Percentage of Population Employed in Office & Administration in Arvada, CO?
Percentage of Population Employed in Office & Administration in Arvada is 10.8%.
What is the Percentage of Population Employed in Office & Administration in Colorado?
Percentage of Population Employed in Office & Administration in Colorado is 10.1%.
What is the Percentage of Population Employed in Office & Administration in the United States?
Percentage of Population Employed in Office & Administration in the United States is 10.9%.