Zip Codes with the Highest Percentage of Population Employed in Accommodation & Food Services in Rogers, AR
RELATED REPORTS & OPTIONS
Accommodation & Food Services
Rogers
Compare Zip Codes
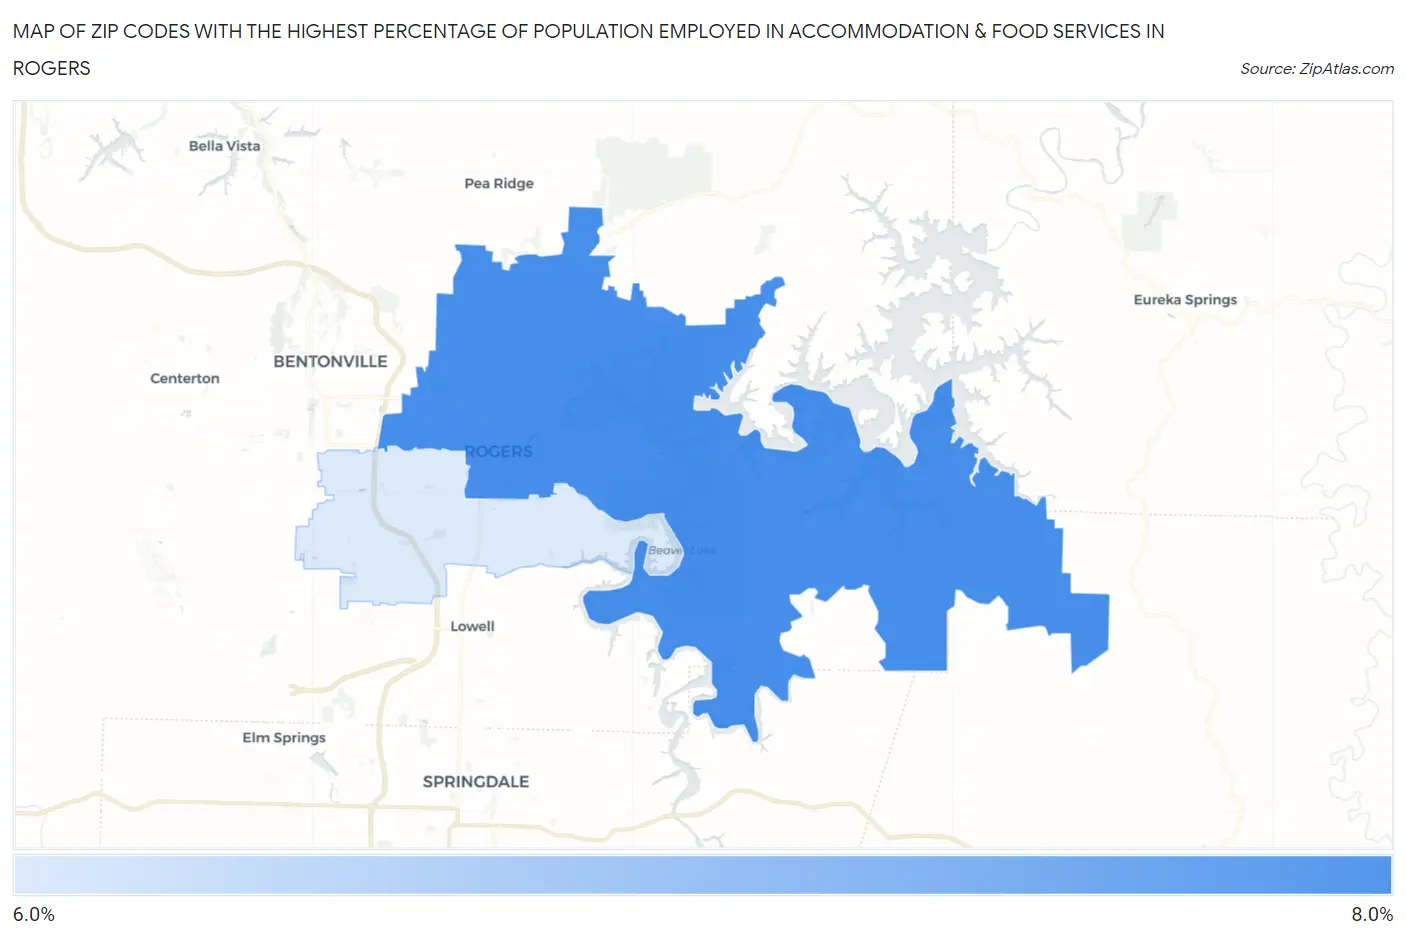
Map of Zip Codes with the Highest Percentage of Population Employed in Accommodation & Food Services in Rogers
6.1%
7.0%
Zip Codes with the Highest Percentage of Population Employed in Accommodation & Food Services in Rogers, AR
| Zip Code | % Employed | vs State | vs National | |
| 1. | 72756 | 7.0% | 6.6%(+0.343)#138 | 6.9%(+0.101)#10,362 |
| 2. | 72758 | 6.1% | 6.6%(-0.587)#181 | 6.9%(-0.829)#13,295 |
1
Common Questions
What are the Top Zip Codes with the Highest Percentage of Population Employed in Accommodation & Food Services in Rogers, AR?
Top Zip Codes with the Highest Percentage of Population Employed in Accommodation & Food Services in Rogers, AR are:
What zip code has the Highest Percentage of Population Employed in Accommodation & Food Services in Rogers, AR?
72756 has the Highest Percentage of Population Employed in Accommodation & Food Services in Rogers, AR with 7.0%.
What is the Percentage of Population Employed in Accommodation & Food Services in Rogers, AR?
Percentage of Population Employed in Accommodation & Food Services in Rogers is 6.8%.
What is the Percentage of Population Employed in Accommodation & Food Services in Arkansas?
Percentage of Population Employed in Accommodation & Food Services in Arkansas is 6.6%.
What is the Percentage of Population Employed in Accommodation & Food Services in the United States?
Percentage of Population Employed in Accommodation & Food Services in the United States is 6.9%.