Zip Codes with the Highest Percentage of Population Employed in Architecture & Engineering in Bryan, TX
RELATED REPORTS & OPTIONS
Architecture & Engineering
Bryan
Compare Zip Codes
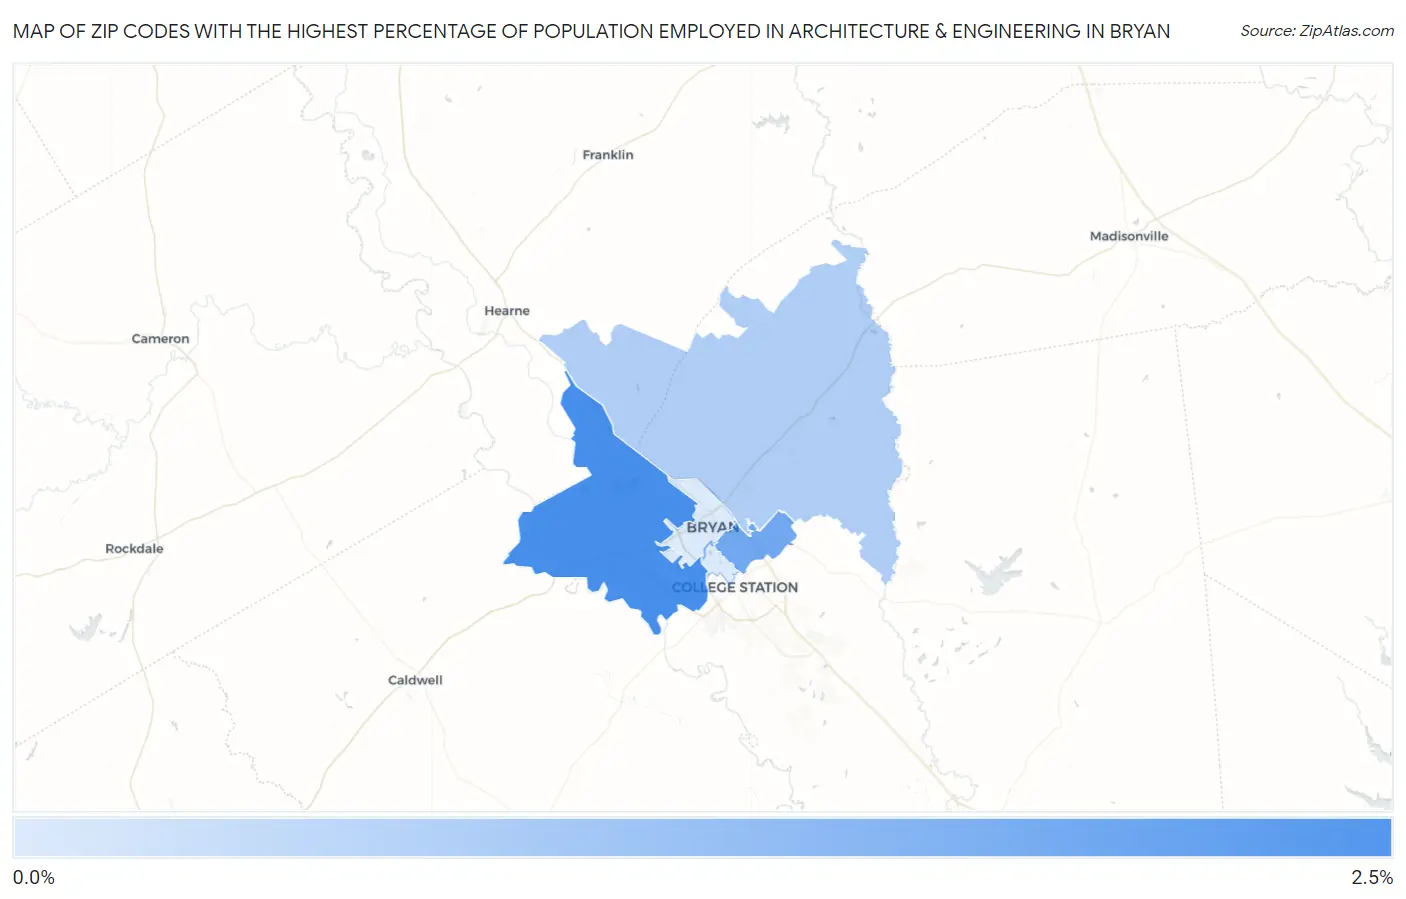
Map of Zip Codes with the Highest Percentage of Population Employed in Architecture & Engineering in Bryan
0.49%
2.4%
Zip Codes with the Highest Percentage of Population Employed in Architecture & Engineering in Bryan, TX
| Zip Code | % Employed | vs State | vs National | |
| 1. | 77807 | 2.4% | 2.2%(+0.192)#406 | 2.1%(+0.265)#7,414 |
| 2. | 77802 | 1.9% | 2.2%(-0.356)#567 | 2.1%(-0.283)#10,451 |
| 3. | 77808 | 1.1% | 2.2%(-1.14)#854 | 2.1%(-1.06)#15,984 |
| 4. | 77803 | 0.50% | 2.2%(-1.72)#1,126 | 2.1%(-1.65)#20,264 |
| 5. | 77801 | 0.49% | 2.2%(-1.73)#1,129 | 2.1%(-1.66)#20,345 |
1
Common Questions
What are the Top 3 Zip Codes with the Highest Percentage of Population Employed in Architecture & Engineering in Bryan, TX?
Top 3 Zip Codes with the Highest Percentage of Population Employed in Architecture & Engineering in Bryan, TX are:
What zip code has the Highest Percentage of Population Employed in Architecture & Engineering in Bryan, TX?
77807 has the Highest Percentage of Population Employed in Architecture & Engineering in Bryan, TX with 2.4%.
What is the Percentage of Population Employed in Architecture & Engineering in Bryan, TX?
Percentage of Population Employed in Architecture & Engineering in Bryan is 1.2%.
What is the Percentage of Population Employed in Architecture & Engineering in Texas?
Percentage of Population Employed in Architecture & Engineering in Texas is 2.2%.
What is the Percentage of Population Employed in Architecture & Engineering in the United States?
Percentage of Population Employed in Architecture & Engineering in the United States is 2.1%.