Zip Codes with the Highest Percentage of Population Employed in Architecture & Engineering in San Angelo, TX
RELATED REPORTS & OPTIONS
Architecture & Engineering
San Angelo
Compare Zip Codes
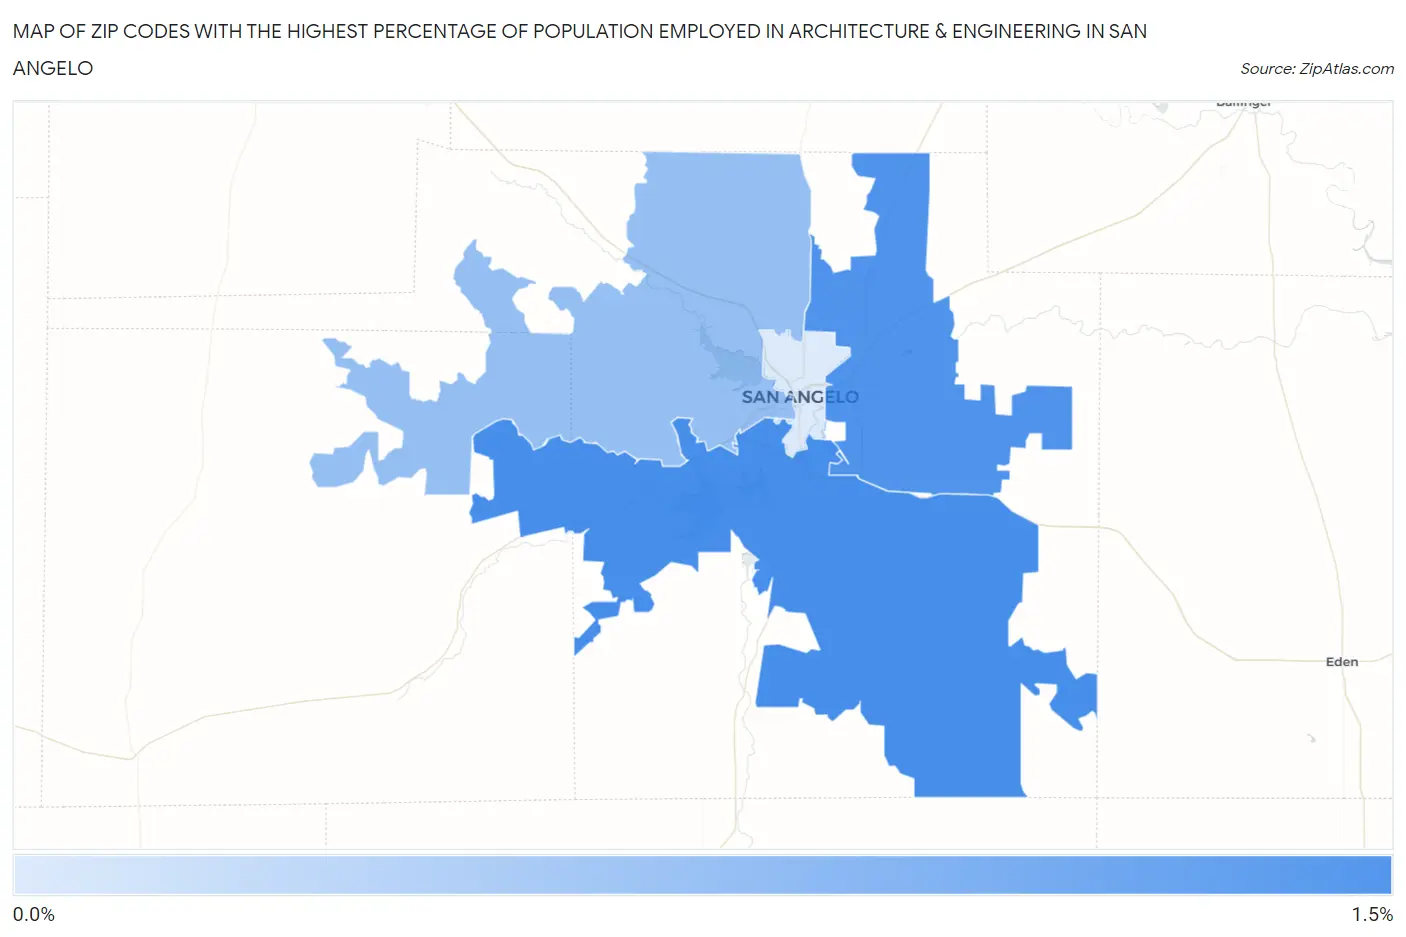
Map of Zip Codes with the Highest Percentage of Population Employed in Architecture & Engineering in San Angelo
0.35%
1.4%
Zip Codes with the Highest Percentage of Population Employed in Architecture & Engineering in San Angelo, TX
| Zip Code | % Employed | vs State | vs National | |
| 1. | 76904 | 1.4% | 2.2%(-0.828)#747 | 2.1%(-0.755)#13,631 |
| 2. | 76905 | 1.3% | 2.2%(-0.892)#762 | 2.1%(-0.819)#14,092 |
| 3. | 76901 | 0.84% | 2.2%(-1.38)#965 | 2.1%(-1.31)#17,824 |
| 4. | 76903 | 0.35% | 2.2%(-1.87)#1,207 | 2.1%(-1.80)#21,260 |
1
Common Questions
What are the Top 3 Zip Codes with the Highest Percentage of Population Employed in Architecture & Engineering in San Angelo, TX?
Top 3 Zip Codes with the Highest Percentage of Population Employed in Architecture & Engineering in San Angelo, TX are:
What zip code has the Highest Percentage of Population Employed in Architecture & Engineering in San Angelo, TX?
76904 has the Highest Percentage of Population Employed in Architecture & Engineering in San Angelo, TX with 1.4%.
What is the Percentage of Population Employed in Architecture & Engineering in San Angelo, TX?
Percentage of Population Employed in Architecture & Engineering in San Angelo is 0.92%.
What is the Percentage of Population Employed in Architecture & Engineering in Texas?
Percentage of Population Employed in Architecture & Engineering in Texas is 2.2%.
What is the Percentage of Population Employed in Architecture & Engineering in the United States?
Percentage of Population Employed in Architecture & Engineering in the United States is 2.1%.