Zip Codes with the Highest Percentage of Population Employed in Architecture & Engineering in Beaumont, TX
RELATED REPORTS & OPTIONS
Architecture & Engineering
Beaumont
Compare Zip Codes
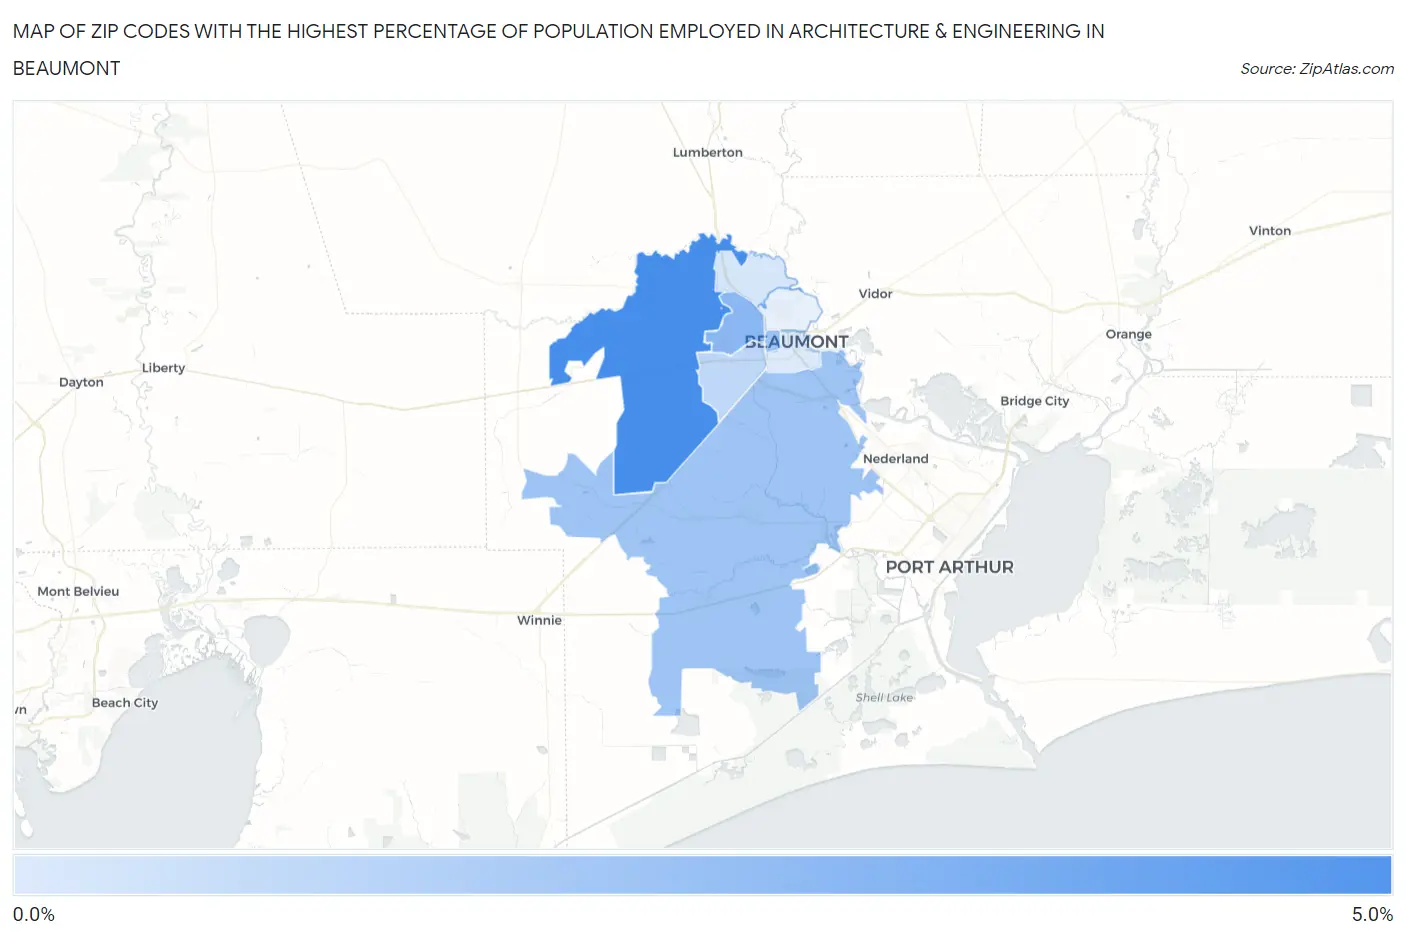
Map of Zip Codes with the Highest Percentage of Population Employed in Architecture & Engineering in Beaumont
0.80%
4.7%
Zip Codes with the Highest Percentage of Population Employed in Architecture & Engineering in Beaumont, TX
| Zip Code | % Employed | vs State | vs National | |
| 1. | 77713 | 4.7% | 2.2%(+2.53)#105 | 2.1%(+2.60)#1,884 |
| 2. | 77706 | 3.0% | 2.2%(+0.758)#304 | 2.1%(+0.831)#5,122 |
| 3. | 77702 | 2.4% | 2.2%(+0.218)#395 | 2.1%(+0.291)#7,274 |
| 4. | 77705 | 2.4% | 2.2%(+0.218)#396 | 2.1%(+0.290)#7,276 |
| 5. | 77707 | 1.6% | 2.2%(-0.638)#677 | 2.1%(-0.565)#12,280 |
| 6. | 77708 | 0.96% | 2.2%(-1.26)#914 | 2.1%(-1.18)#16,887 |
| 7. | 77701 | 0.80% | 2.2%(-1.42)#981 | 2.1%(-1.34)#18,101 |
1
Common Questions
What are the Top 5 Zip Codes with the Highest Percentage of Population Employed in Architecture & Engineering in Beaumont, TX?
Top 5 Zip Codes with the Highest Percentage of Population Employed in Architecture & Engineering in Beaumont, TX are:
What zip code has the Highest Percentage of Population Employed in Architecture & Engineering in Beaumont, TX?
77713 has the Highest Percentage of Population Employed in Architecture & Engineering in Beaumont, TX with 4.7%.
What is the Percentage of Population Employed in Architecture & Engineering in Beaumont, TX?
Percentage of Population Employed in Architecture & Engineering in Beaumont is 2.3%.
What is the Percentage of Population Employed in Architecture & Engineering in Texas?
Percentage of Population Employed in Architecture & Engineering in Texas is 2.2%.
What is the Percentage of Population Employed in Architecture & Engineering in the United States?
Percentage of Population Employed in Architecture & Engineering in the United States is 2.1%.