Zip Codes with the Highest Percentage of Population Employed in Architecture & Engineering in Abilene, TX
RELATED REPORTS & OPTIONS
Architecture & Engineering
Abilene
Compare Zip Codes
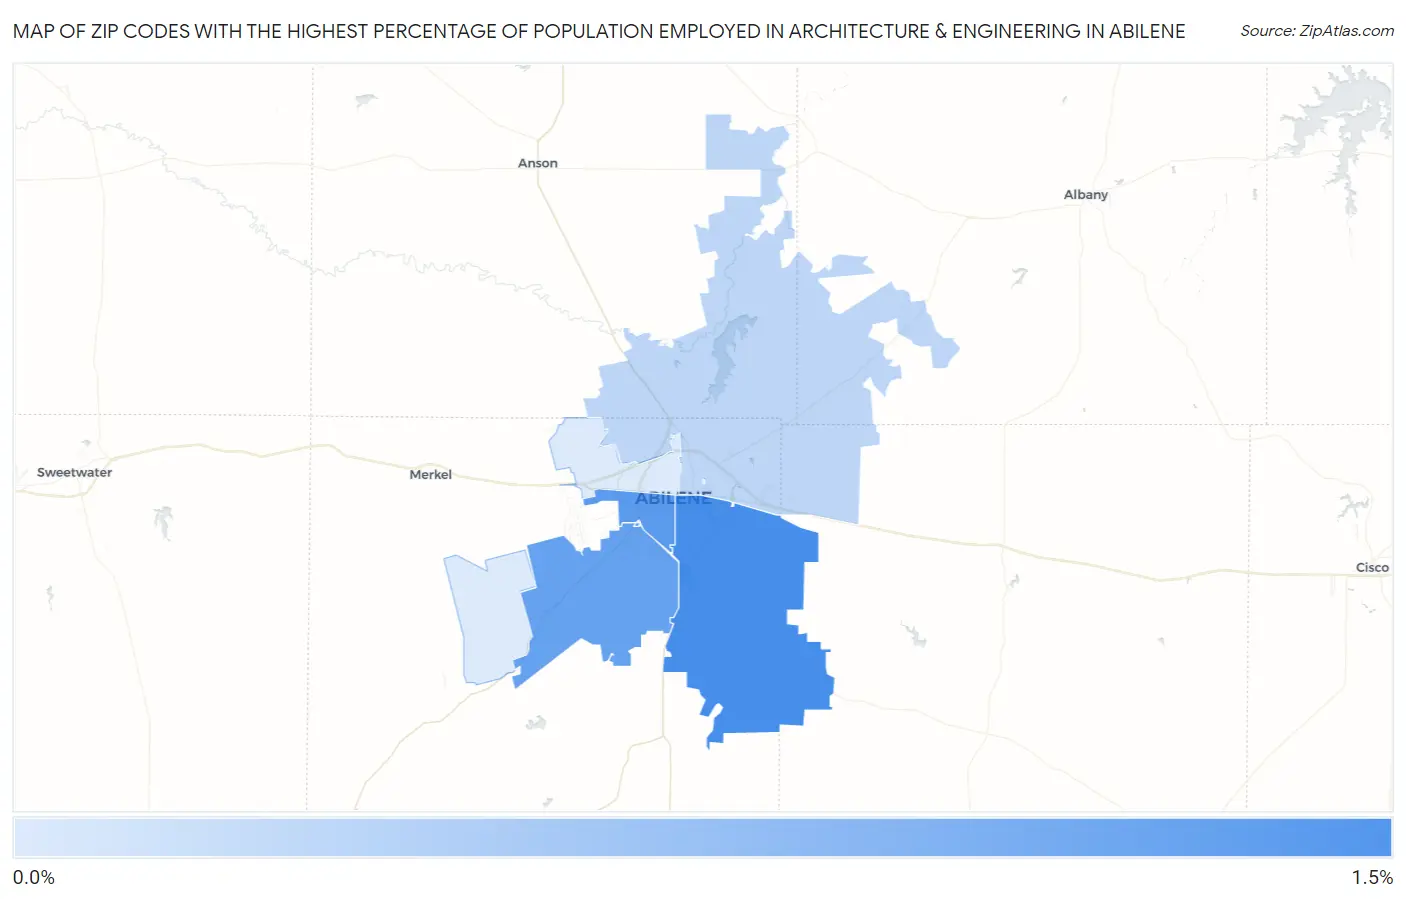
Map of Zip Codes with the Highest Percentage of Population Employed in Architecture & Engineering in Abilene
0.24%
1.3%
Zip Codes with the Highest Percentage of Population Employed in Architecture & Engineering in Abilene, TX
| Zip Code | % Employed | vs State | vs National | |
| 1. | 79602 | 1.3% | 2.2%(-0.922)#777 | 2.1%(-0.850)#14,305 |
| 2. | 79605 | 1.2% | 2.2%(-1.06)#824 | 2.1%(-0.985)#15,373 |
| 3. | 79606 | 1.1% | 2.2%(-1.14)#859 | 2.1%(-1.07)#16,035 |
| 4. | 79601 | 0.47% | 2.2%(-1.75)#1,137 | 2.1%(-1.68)#20,477 |
| 5. | 79603 | 0.24% | 2.2%(-1.98)#1,248 | 2.1%(-1.91)#21,857 |
1
Common Questions
What are the Top 5 Zip Codes with the Highest Percentage of Population Employed in Architecture & Engineering in Abilene, TX?
Top 5 Zip Codes with the Highest Percentage of Population Employed in Architecture & Engineering in Abilene, TX are:
What zip code has the Highest Percentage of Population Employed in Architecture & Engineering in Abilene, TX?
79602 has the Highest Percentage of Population Employed in Architecture & Engineering in Abilene, TX with 1.3%.
What is the Percentage of Population Employed in Architecture & Engineering in Abilene, TX?
Percentage of Population Employed in Architecture & Engineering in Abilene is 0.93%.
What is the Percentage of Population Employed in Architecture & Engineering in Texas?
Percentage of Population Employed in Architecture & Engineering in Texas is 2.2%.
What is the Percentage of Population Employed in Architecture & Engineering in the United States?
Percentage of Population Employed in Architecture & Engineering in the United States is 2.1%.