Zip Codes with the Highest Percentage of Population Employed in Architecture & Engineering in Baytown, TX
RELATED REPORTS & OPTIONS
Architecture & Engineering
Baytown
Compare Zip Codes
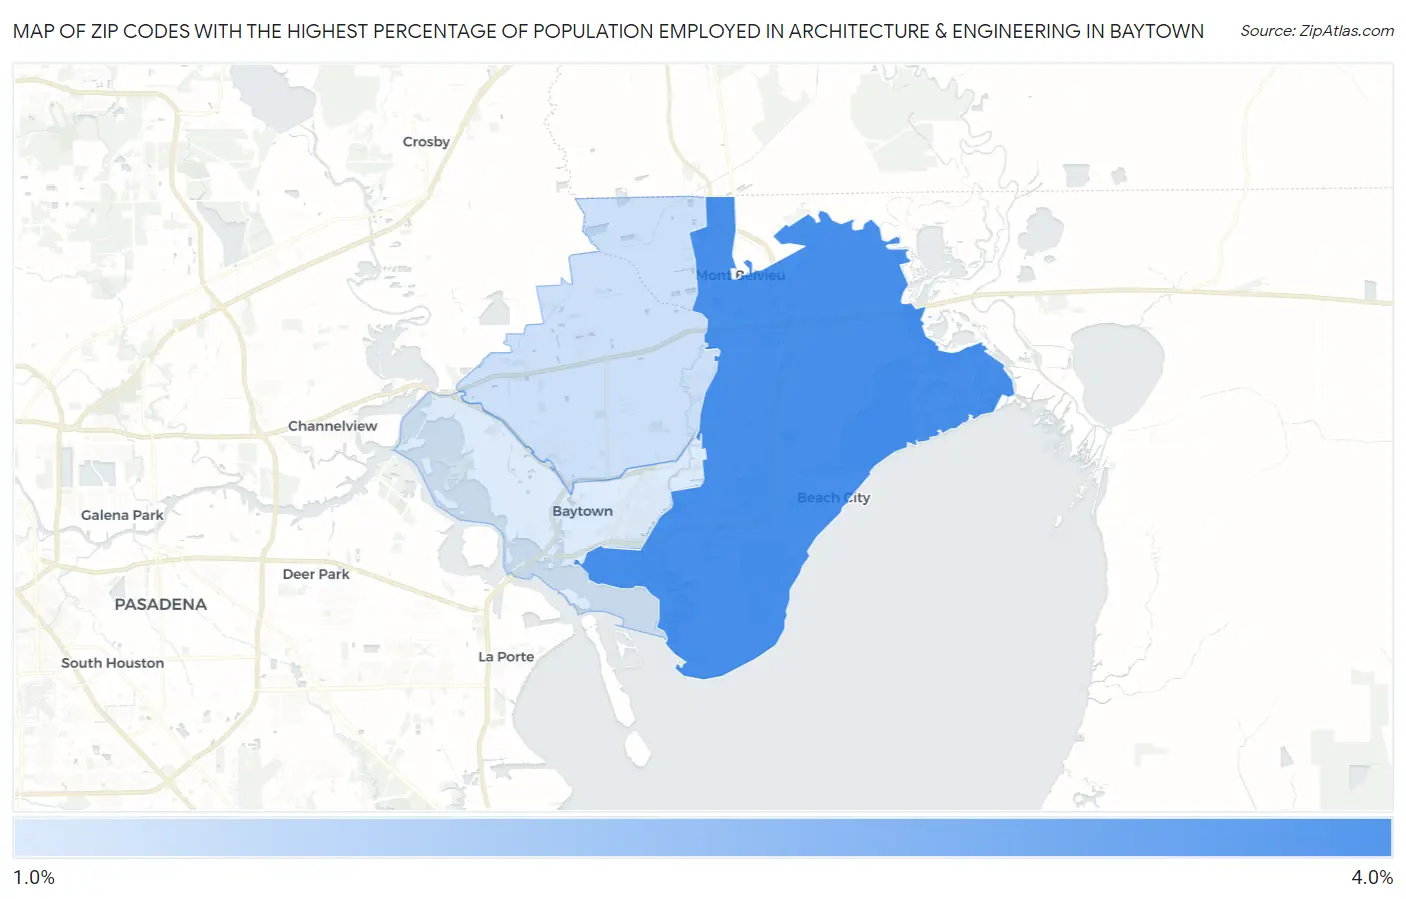
Map of Zip Codes with the Highest Percentage of Population Employed in Architecture & Engineering in Baytown
1.7%
3.7%
Zip Codes with the Highest Percentage of Population Employed in Architecture & Engineering in Baytown, TX
| Zip Code | % Employed | vs State | vs National | |
| 1. | 77523 | 3.7% | 2.2%(+1.49)#181 | 2.1%(+1.56)#3,264 |
| 2. | 77521 | 2.0% | 2.2%(-0.253)#536 | 2.1%(-0.180)#9,803 |
| 3. | 77520 | 1.7% | 2.2%(-0.475)#606 | 2.1%(-0.402)#11,181 |
1
Common Questions
What are the Top Zip Codes with the Highest Percentage of Population Employed in Architecture & Engineering in Baytown, TX?
Top Zip Codes with the Highest Percentage of Population Employed in Architecture & Engineering in Baytown, TX are:
What zip code has the Highest Percentage of Population Employed in Architecture & Engineering in Baytown, TX?
77523 has the Highest Percentage of Population Employed in Architecture & Engineering in Baytown, TX with 3.7%.
What is the Percentage of Population Employed in Architecture & Engineering in Baytown, TX?
Percentage of Population Employed in Architecture & Engineering in Baytown is 2.0%.
What is the Percentage of Population Employed in Architecture & Engineering in Texas?
Percentage of Population Employed in Architecture & Engineering in Texas is 2.2%.
What is the Percentage of Population Employed in Architecture & Engineering in the United States?
Percentage of Population Employed in Architecture & Engineering in the United States is 2.1%.