Zip Codes with the Highest Percentage of Population Employed in Architecture & Engineering in Bedford, TX
RELATED REPORTS & OPTIONS
Architecture & Engineering
Bedford
Compare Zip Codes
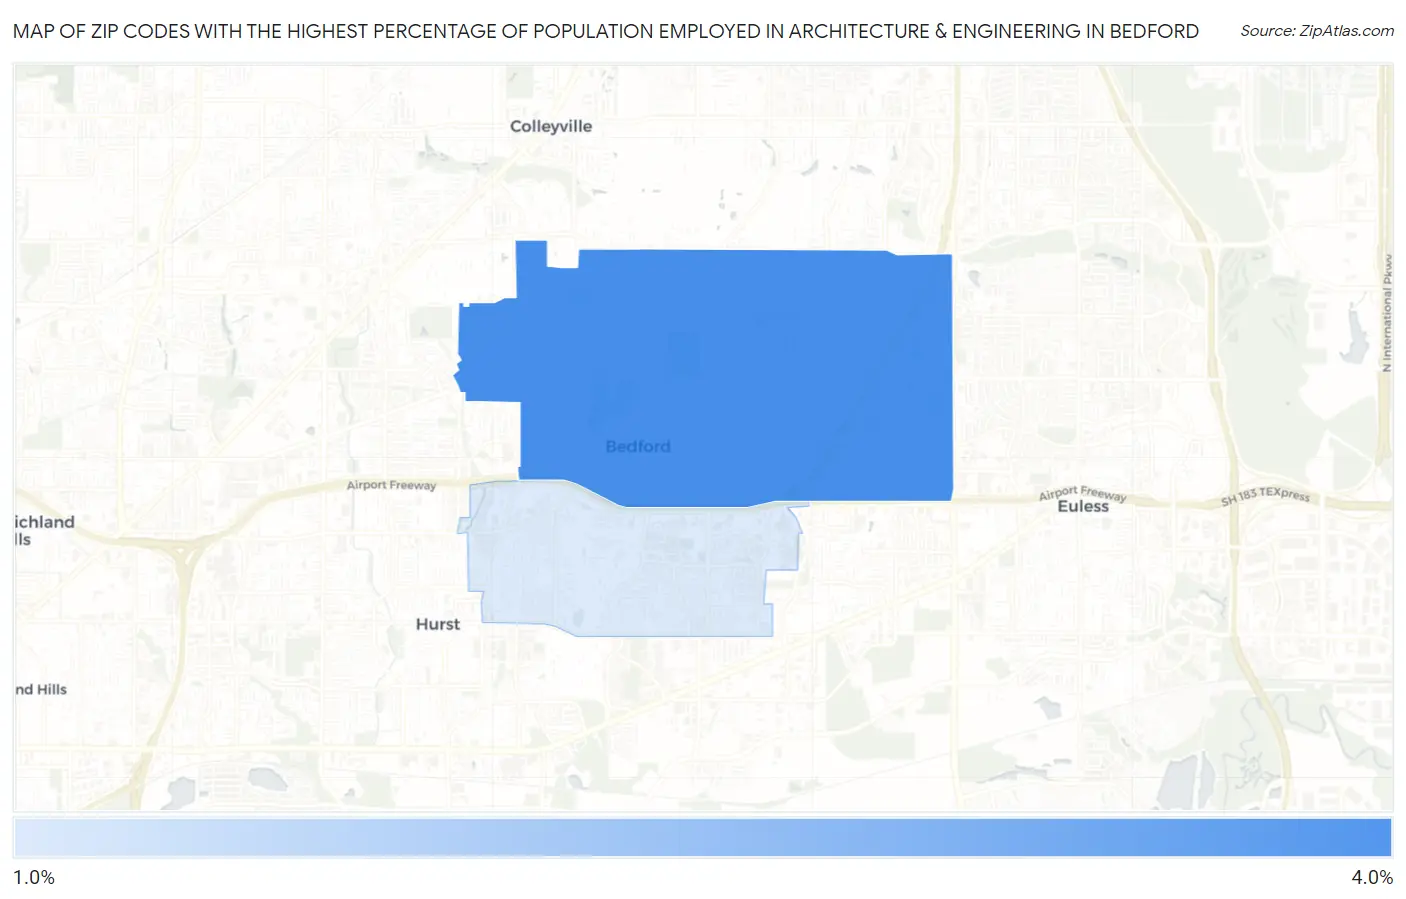
Map of Zip Codes with the Highest Percentage of Population Employed in Architecture & Engineering in Bedford
1.3%
3.4%
Zip Codes with the Highest Percentage of Population Employed in Architecture & Engineering in Bedford, TX
| Zip Code | % Employed | vs State | vs National | |
| 1. | 76021 | 3.4% | 2.2%(+1.13)#230 | 2.1%(+1.20)#4,061 |
| 2. | 76022 | 1.3% | 2.2%(-0.892)#763 | 2.1%(-0.819)#14,098 |
1
Common Questions
What are the Top Zip Codes with the Highest Percentage of Population Employed in Architecture & Engineering in Bedford, TX?
Top Zip Codes with the Highest Percentage of Population Employed in Architecture & Engineering in Bedford, TX are:
What zip code has the Highest Percentage of Population Employed in Architecture & Engineering in Bedford, TX?
76021 has the Highest Percentage of Population Employed in Architecture & Engineering in Bedford, TX with 3.4%.
What is the Percentage of Population Employed in Architecture & Engineering in Bedford, TX?
Percentage of Population Employed in Architecture & Engineering in Bedford is 2.8%.
What is the Percentage of Population Employed in Architecture & Engineering in Texas?
Percentage of Population Employed in Architecture & Engineering in Texas is 2.2%.
What is the Percentage of Population Employed in Architecture & Engineering in the United States?
Percentage of Population Employed in Architecture & Engineering in the United States is 2.1%.