Zip Codes with the Highest Percentage of Population Employed in Architecture & Engineering in Pasadena, TX
RELATED REPORTS & OPTIONS
Architecture & Engineering
Pasadena
Compare Zip Codes
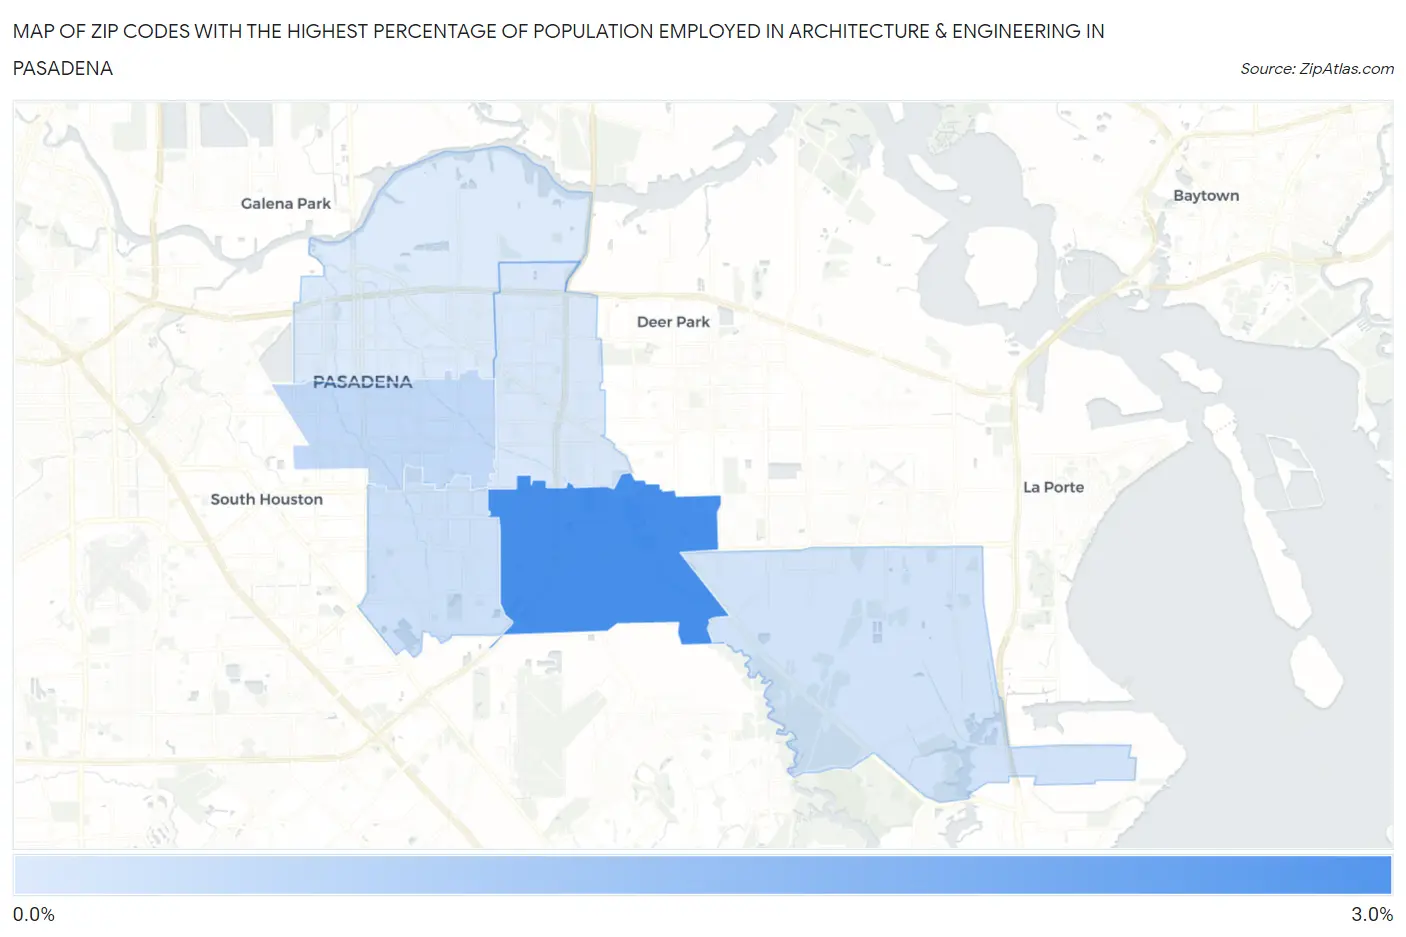
Map of Zip Codes with the Highest Percentage of Population Employed in Architecture & Engineering in Pasadena
0.65%
2.9%
Zip Codes with the Highest Percentage of Population Employed in Architecture & Engineering in Pasadena, TX
| Zip Code | % Employed | vs State | vs National | |
| 1. | 77505 | 2.9% | 2.2%(+0.722)#307 | 2.1%(+0.795)#5,257 |
| 2. | 77502 | 1.1% | 2.2%(-1.16)#865 | 2.1%(-1.09)#16,163 |
| 3. | 77504 | 0.90% | 2.2%(-1.32)#939 | 2.1%(-1.25)#17,372 |
| 4. | 77507 | 0.81% | 2.2%(-1.41)#980 | 2.1%(-1.34)#18,054 |
| 5. | 77503 | 0.73% | 2.2%(-1.50)#1,018 | 2.1%(-1.42)#18,723 |
| 6. | 77506 | 0.65% | 2.2%(-1.57)#1,063 | 2.1%(-1.50)#19,232 |
1
Common Questions
What are the Top 5 Zip Codes with the Highest Percentage of Population Employed in Architecture & Engineering in Pasadena, TX?
Top 5 Zip Codes with the Highest Percentage of Population Employed in Architecture & Engineering in Pasadena, TX are:
What zip code has the Highest Percentage of Population Employed in Architecture & Engineering in Pasadena, TX?
77505 has the Highest Percentage of Population Employed in Architecture & Engineering in Pasadena, TX with 2.9%.
What is the Percentage of Population Employed in Architecture & Engineering in Pasadena, TX?
Percentage of Population Employed in Architecture & Engineering in Pasadena is 1.8%.
What is the Percentage of Population Employed in Architecture & Engineering in Texas?
Percentage of Population Employed in Architecture & Engineering in Texas is 2.2%.
What is the Percentage of Population Employed in Architecture & Engineering in the United States?
Percentage of Population Employed in Architecture & Engineering in the United States is 2.1%.