Zip Codes with the Highest Percentage of Population Employed in Architecture & Engineering in Mission, TX
RELATED REPORTS & OPTIONS
Architecture & Engineering
Mission
Compare Zip Codes
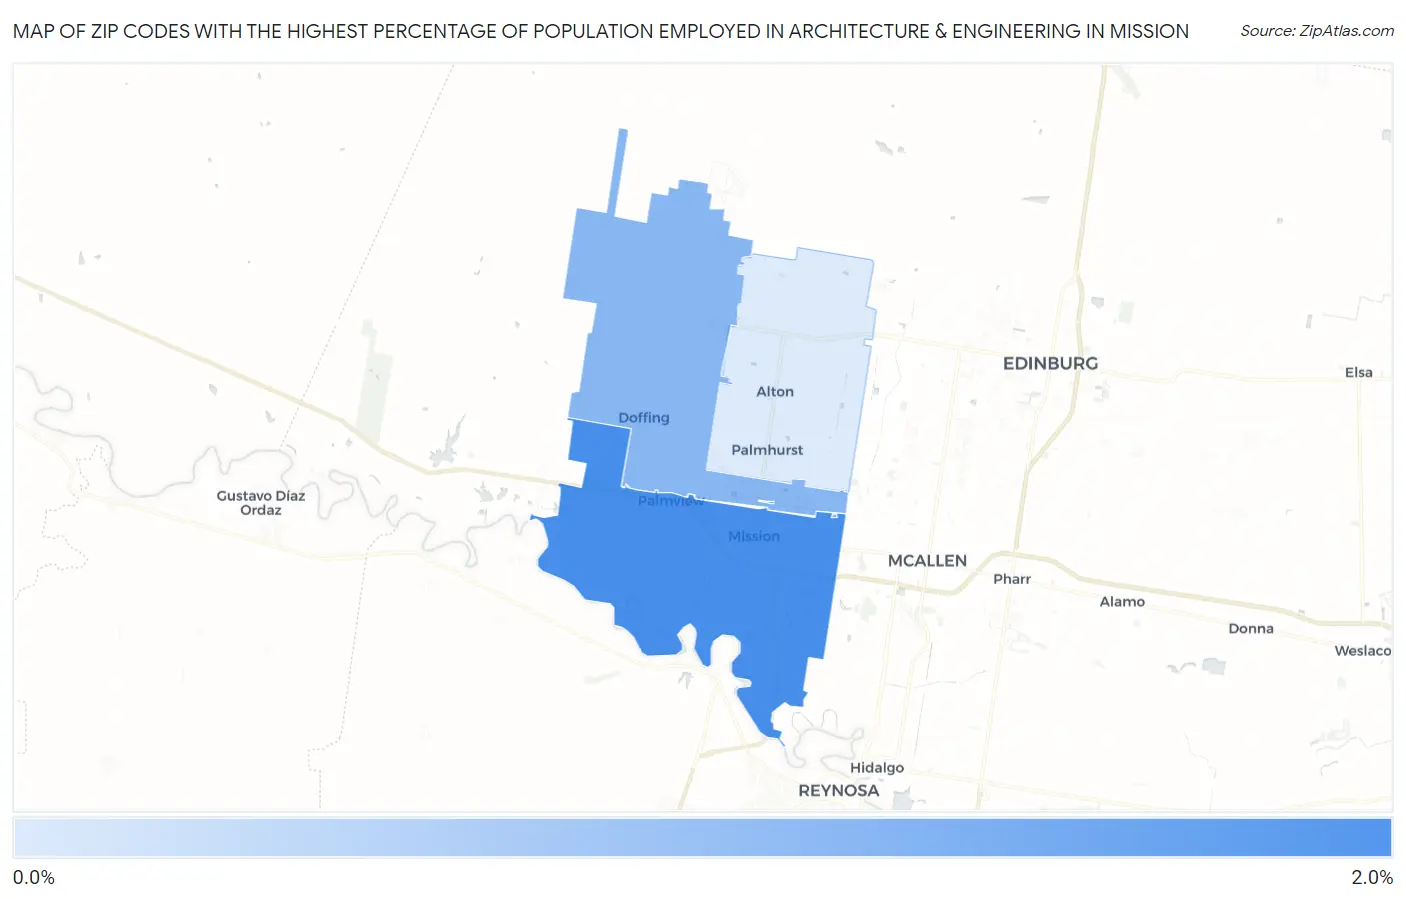
Map of Zip Codes with the Highest Percentage of Population Employed in Architecture & Engineering in Mission
0.40%
1.8%
Zip Codes with the Highest Percentage of Population Employed in Architecture & Engineering in Mission, TX
| Zip Code | % Employed | vs State | vs National | |
| 1. | 78572 | 1.8% | 2.2%(-0.420)#583 | 2.1%(-0.347)#10,805 |
| 2. | 78574 | 1.2% | 2.2%(-1.03)#813 | 2.1%(-0.958)#15,153 |
| 3. | 78573 | 0.40% | 2.2%(-1.82)#1,179 | 2.1%(-1.75)#20,935 |
1
Common Questions
What are the Top Zip Codes with the Highest Percentage of Population Employed in Architecture & Engineering in Mission, TX?
Top Zip Codes with the Highest Percentage of Population Employed in Architecture & Engineering in Mission, TX are:
What zip code has the Highest Percentage of Population Employed in Architecture & Engineering in Mission, TX?
78572 has the Highest Percentage of Population Employed in Architecture & Engineering in Mission, TX with 1.8%.
What is the Percentage of Population Employed in Architecture & Engineering in Mission, TX?
Percentage of Population Employed in Architecture & Engineering in Mission is 2.2%.
What is the Percentage of Population Employed in Architecture & Engineering in Texas?
Percentage of Population Employed in Architecture & Engineering in Texas is 2.2%.
What is the Percentage of Population Employed in Architecture & Engineering in the United States?
Percentage of Population Employed in Architecture & Engineering in the United States is 2.1%.