Zip Codes with the Highest Percentage of Population Employed in Architecture & Engineering in Duncanville, TX
RELATED REPORTS & OPTIONS
Architecture & Engineering
Duncanville
Compare Zip Codes
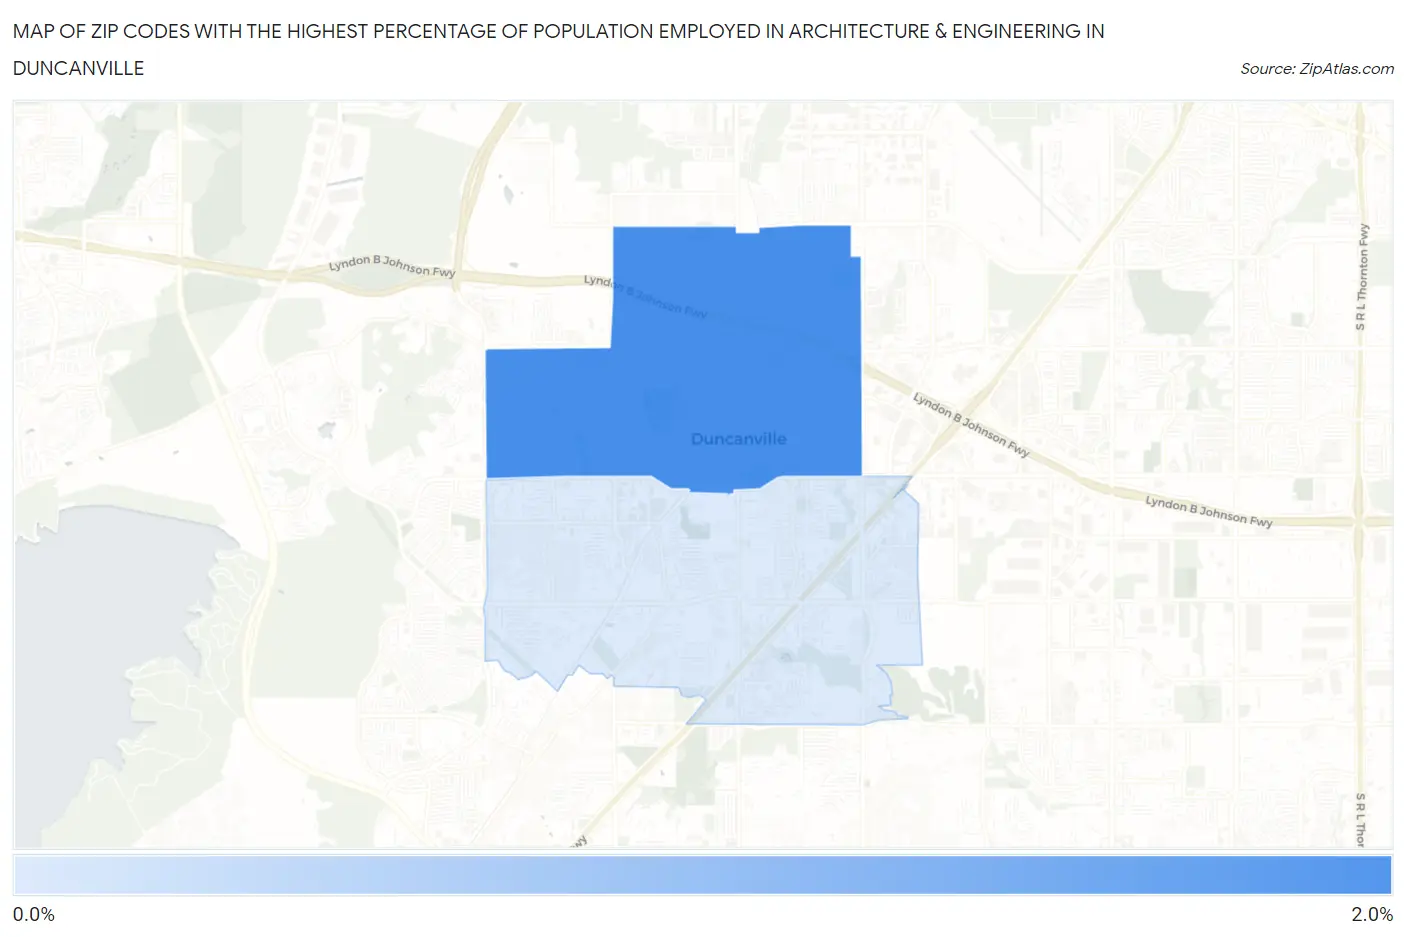
Map of Zip Codes with the Highest Percentage of Population Employed in Architecture & Engineering in Duncanville
0.85%
1.7%
Zip Codes with the Highest Percentage of Population Employed in Architecture & Engineering in Duncanville, TX
| Zip Code | % Employed | vs State | vs National | |
| 1. | 75116 | 1.7% | 2.2%(-0.558)#643 | 2.1%(-0.485)#11,745 |
| 2. | 75137 | 0.85% | 2.2%(-1.37)#961 | 2.1%(-1.30)#17,748 |
1
Common Questions
What are the Top Zip Codes with the Highest Percentage of Population Employed in Architecture & Engineering in Duncanville, TX?
Top Zip Codes with the Highest Percentage of Population Employed in Architecture & Engineering in Duncanville, TX are:
What zip code has the Highest Percentage of Population Employed in Architecture & Engineering in Duncanville, TX?
75116 has the Highest Percentage of Population Employed in Architecture & Engineering in Duncanville, TX with 1.7%.
What is the Percentage of Population Employed in Architecture & Engineering in Duncanville, TX?
Percentage of Population Employed in Architecture & Engineering in Duncanville is 1.2%.
What is the Percentage of Population Employed in Architecture & Engineering in Texas?
Percentage of Population Employed in Architecture & Engineering in Texas is 2.2%.
What is the Percentage of Population Employed in Architecture & Engineering in the United States?
Percentage of Population Employed in Architecture & Engineering in the United States is 2.1%.