Zip Codes with the Highest Percentage of Population Employed in Legal Services & Support in Fort Worth, TX

RELATED REPORTS & OPTIONS

Legal Services & Support
Population
Families and Households
Female Fertility
Female Fertility (Unmarried)
Race (Community Size)
Race (Percentage)
Ancestry (Community Size)
AfghanAfricanAlbanianAlsatianAmericanApacheArabArgentineanArmenianAustralianAustrianBahamianBangladeshiBarbadianBasqueBelgianBhutaneseBlackfeetBolivianBrazilianBritishBritish West IndianBulgarianBurmeseCajunCambodianCanadianCelticCentral AmericanCentral American IndianCherokeeCheyenneChickasawChileanChippewaChoctawColombianComancheCosta RicanCreekCroatianCrowCubanCzechCzechoslovakianDanishDelawareDominicanDutchDutch West IndianEastern EuropeanEcuadorianEgyptianEnglishEstonianEthiopianEuropeanFilipinoFinnishFrenchFrench American IndianFrench CanadianGermanGerman RussianGhanaianGreekGuamanian / ChamorroGuatemalanGuyaneseHaitianHonduranHopiHungarianIcelanderIndian (Asian)IndonesianInupiatIranianIraqiIrishIroquoisIsraeliItalianJamaicanJapaneseJordanianKenyanKiowaKoreanLaotianLatvianLebaneseLiberianLithuanianLuxembourgerMalaysianMalteseMexicanMexican American IndianMongolianMoroccanNative HawaiianNavajoNicaraguanNigerianNorthern EuropeanNorwegianOsageOttawaPakistaniPalestinianPanamanianPennsylvania GermanPeruvianPolishPortuguesePotawatomiPuebloPuerto RicanRomanianRussianSalvadoranSamoanScandinavianScotch-IrishScottishSerbianSiouxSlavicSlovakSloveneSomaliSouth AfricanSouth AmericanSouth American IndianSpaniardSpanishSpanish AmericanSpanish American IndianSri LankanSubsaharan AfricanSudaneseSwedishSwissSyrianThaiTonganTrinidadian and TobagonianTurkishUgandanUkrainianVenezuelanVietnameseWelshWest IndianYaquiYugoslavianZimbabwean
Ancestry (Percentage)
AfghanAfricanAlbanianAlsatianAmericanApacheArabArgentineanArmenianAustralianAustrianBahamianBangladeshiBarbadianBasqueBelgianBhutaneseBlackfeetBolivianBrazilianBritishBritish West IndianBulgarianBurmeseCajunCambodianCanadianCelticCentral AmericanCentral American IndianCherokeeCheyenneChickasawChileanChippewaChoctawColombianComancheCosta RicanCreekCroatianCrowCubanCzechCzechoslovakianDanishDelawareDominicanDutchDutch West IndianEastern EuropeanEcuadorianEgyptianEnglishEstonianEthiopianEuropeanFilipinoFinnishFrenchFrench American IndianFrench CanadianGermanGerman RussianGhanaianGreekGuamanian / ChamorroGuatemalanGuyaneseHaitianHonduranHopiHungarianIcelanderIndian (Asian)IndonesianInupiatIranianIraqiIrishIroquoisIsraeliItalianJamaicanJapaneseJordanianKenyanKiowaKoreanLaotianLatvianLebaneseLiberianLithuanianLuxembourgerMalaysianMalteseMexicanMexican American IndianMongolianMoroccanNative HawaiianNavajoNicaraguanNigerianNorthern EuropeanNorwegianOsageOttawaPakistaniPalestinianPanamanianPennsylvania GermanPeruvianPolishPortuguesePotawatomiPuebloPuerto RicanRomanianRussianSalvadoranSamoanScandinavianScotch-IrishScottishSerbianSiouxSlavicSlovakSloveneSomaliSouth AfricanSouth AmericanSouth American IndianSpaniardSpanishSpanish AmericanSpanish American IndianSri LankanSubsaharan AfricanSudaneseSwedishSwissSyrianThaiTonganTrinidadian and TobagonianTurkishUgandanUkrainianVenezuelanVietnameseWelshWest IndianYaquiYugoslavianZimbabwean
Immigrant Origin (Total)
AfghanistanAfricaAlbaniaArgentinaAsiaAustraliaBahamasBangladeshBarbadosBelarusBelizeBoliviaBosnia and HerzegovinaBrazilBulgariaBurma / MyanmarCambodiaCameroonCanadaCaribbeanCentral AmericaChileChinaColombiaCongoCosta RicaCroatiaCubaCzechoslovakiaDominican RepublicEastern AfricaEastern AsiaEastern EuropeEcuadorEgyptEl SalvadorEnglandEritreaEthiopiaEuropeFranceGermanyGhanaGreeceGuatemalaHaitiHondurasHong KongHungaryIndiaIndonesiaIranIraqIrelandIsraelItalyJamaicaJapanJordanKenyaKoreaLaosLatin AmericaLebanonLiberiaMalaysiaMexicoMicronesiaMiddle AfricaMoroccoNepalNetherlandsNicaraguaNigeriaNorthern AfricaNorthern EuropeOceaniaPakistanPanamaPeruPhilippinesPolandPortugalRomaniaRussiaScotlandSenegalSerbiaSomaliaSouth AfricaSouth AmericaSouth Central AsiaSouth Eastern AsiaSouthern EuropeSpainSri LankaSudanSwedenSwitzerlandSyriaTaiwanThailandTrinidad and TobagoTurkeyUgandaUkraineVenezuelaVietnamWestern AfricaWestern AsiaWestern EuropeZaireZimbabwe
Immigrant Origin (Percentage)
AfghanistanAfricaAlbaniaArgentinaAsiaAustraliaBahamasBangladeshBarbadosBelarusBelizeBoliviaBosnia and HerzegovinaBrazilBulgariaBurma / MyanmarCambodiaCameroonCanadaCaribbeanCentral AmericaChileChinaColombiaCongoCosta RicaCroatiaCubaCzechoslovakiaDominican RepublicEastern AfricaEastern AsiaEastern EuropeEcuadorEgyptEl SalvadorEnglandEritreaEthiopiaEuropeFranceGermanyGhanaGreeceGuatemalaHaitiHondurasHong KongHungaryIndiaIndonesiaIranIraqIrelandIsraelItalyJamaicaJapanJordanKenyaKoreaLaosLatin AmericaLebanonLiberiaMalaysiaMexicoMicronesiaMiddle AfricaMoroccoNepalNetherlandsNicaraguaNigeriaNorthern AfricaNorthern EuropeOceaniaPakistanPanamaPeruPhilippinesPolandPortugalRomaniaRussiaScotlandSenegalSerbiaSomaliaSouth AfricaSouth AmericaSouth Central AsiaSouth Eastern AsiaSouthern EuropeSpainSri LankaSudanSwedenSwitzerlandSyriaTaiwanThailandTrinidad and TobagoTurkeyUgandaUkraineVenezuelaVietnamWestern AfricaWestern AsiaWestern EuropeZaireZimbabwe
Income
Income (Families)
Income (Households)
Poverty
Poverty (Families)
Unemployment
Employment Occupations
Employment Industries
Employer Class
Commute Time
Commute Means
School Enrollment
Education by Degree Field
Occupancy
Finances
Physical Characteristics
Fort Worth
Compare Zip Codes
Comparison Subject

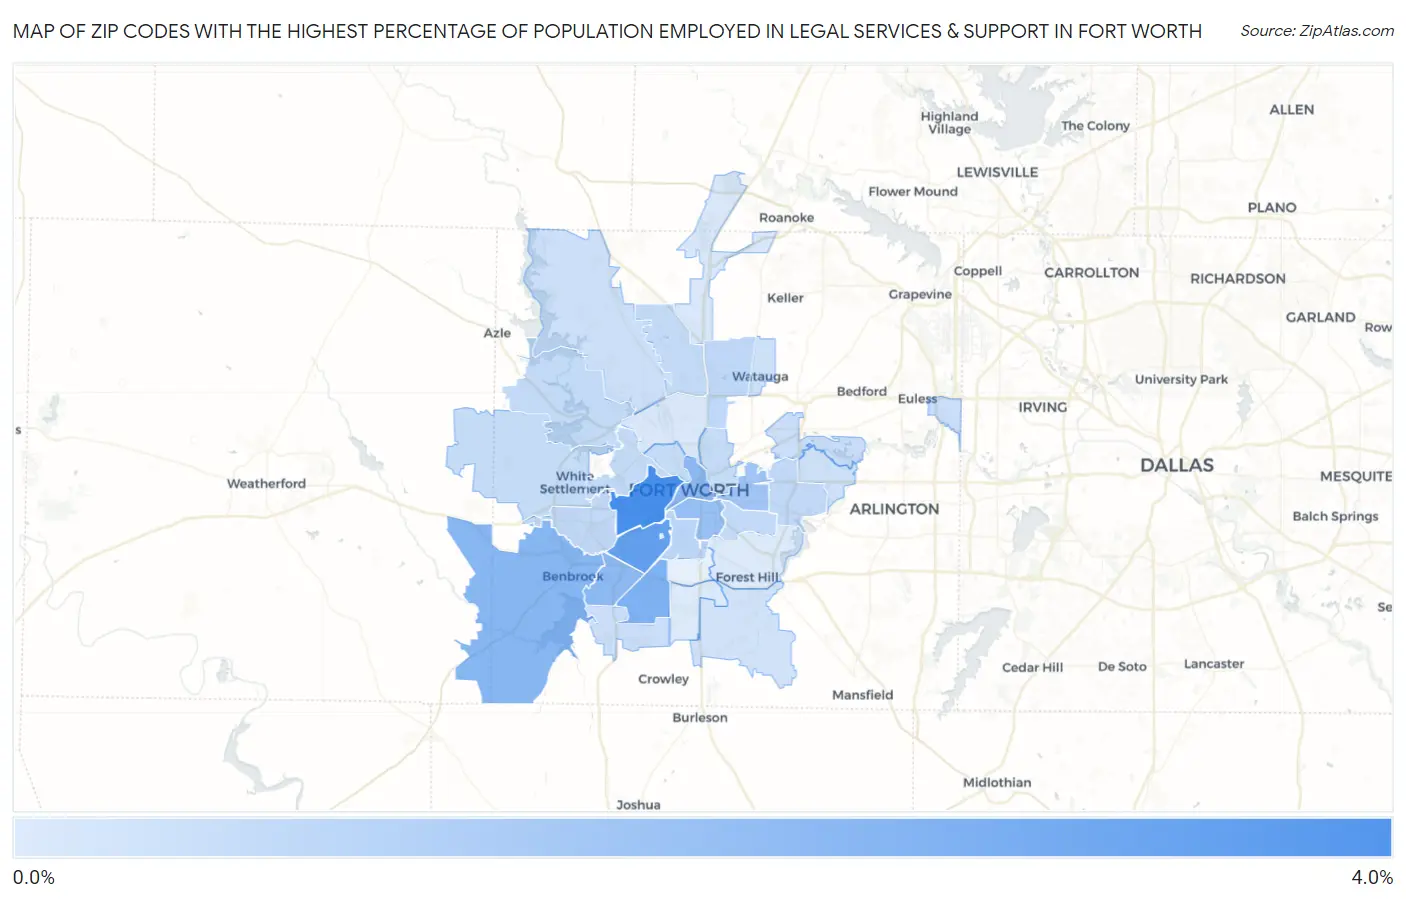
Map of Zip Codes with the Highest Percentage of Population Employed in Legal Services & Support in Fort Worth

0.0%
4.0%
Zip Codes with the Highest Percentage of Population Employed in Legal Services & Support in Fort Worth Map

Zip Codes with the Highest Percentage of Population Employed in Legal Services & Support in Fort Worth, TX

Zip Code % Employed vs State vs National
1.761073.8%1.0%(+2.80)#601.2%(+2.63)#1,226
2.761093.1%1.0%(+2.09)#951.2%(+1.92)#1,746
3.761332.4%1.0%(+1.38)#1471.2%(+1.20)#2,703
4.761262.2%1.0%(+1.16)#1591.2%(+0.988)#3,088
5.761022.0%1.0%(+1.03)#1751.2%(+0.859)#3,354
6.761322.0%1.0%(+1.01)#1801.2%(+0.830)#3,438
7.761041.7%1.0%(+0.726)#2261.2%(+0.550)#4,194
8.761031.5%1.0%(+0.532)#2601.2%(+0.357)#4,888
9.761100.89%1.0%(-0.117)#4891.2%(-0.293)#8,684
10.761370.75%1.0%(-0.262)#5641.2%(-0.437)#9,963
11.761120.73%1.0%(-0.281)#5741.2%(-0.456)#10,129
12.761160.69%1.0%(-0.320)#6121.2%(-0.495)#10,518
13.761050.68%1.0%(-0.331)#6221.2%(-0.507)#10,645
14.761310.66%1.0%(-0.344)#6321.2%(-0.520)#10,791
15.761350.66%1.0%(-0.345)#6331.2%(-0.521)#10,810
16.761140.65%1.0%(-0.356)#6381.2%(-0.532)#10,920
17.761110.61%1.0%(-0.397)#6721.2%(-0.573)#11,348
18.761640.61%1.0%(-0.398)#6731.2%(-0.573)#11,350
19.761080.61%1.0%(-0.402)#6771.2%(-0.578)#11,389
20.761230.50%1.0%(-0.507)#7431.2%(-0.683)#12,618
21.761550.48%1.0%(-0.533)#7801.2%(-0.708)#12,945
22.761180.46%1.0%(-0.543)#7911.2%(-0.719)#13,065
23.761790.42%1.0%(-0.590)#8301.2%(-0.766)#13,633
24.761480.34%1.0%(-0.666)#8921.2%(-0.841)#14,554
25.761200.34%1.0%(-0.671)#8971.2%(-0.847)#14,618
26.761400.31%1.0%(-0.700)#9191.2%(-0.876)#14,944
27.761060.15%1.0%(-0.863)#1,0331.2%(-1.04)#16,728
28.761770.14%1.0%(-0.869)#1,0391.2%(-1.04)#16,803
29.761340.036%1.0%(-0.972)#1,1051.2%(-1.15)#17,468
30.761190.020%1.0%(-0.988)#1,1111.2%(-1.16)#17,499

Common Questions

What are the Top 10 Zip Codes with the Highest Percentage of Population Employed in Legal Services & Support in Fort Worth, TX?
Top 10 Zip Codes with the Highest Percentage of Population Employed in Legal Services & Support in Fort Worth, TX are:
#1
3.8%
#2
3.1%
#3
2.4%
#4
2.2%
#5
2.0%
#6
2.0%
#7
1.7%
#8
1.5%
#9
0.89%
#10
0.75%
What zip code has the Highest Percentage of Population Employed in Legal Services & Support in Fort Worth, TX?
76107 has the Highest Percentage of Population Employed in Legal Services & Support in Fort Worth, TX with 3.8%.
What is the Percentage of Population Employed in Legal Services & Support in Fort Worth, TX?
Percentage of Population Employed in Legal Services & Support in Fort Worth is 1.0%.
What is the Percentage of Population Employed in Legal Services & Support in Texas?
Percentage of Population Employed in Legal Services & Support in Texas is 1.0%.
What is the Percentage of Population Employed in Legal Services & Support in the United States?
Percentage of Population Employed in Legal Services & Support in the United States is 1.2%.