Zip Codes with the Highest Percentage of Population with a Degree in Arts and Humanities in Fort Worth, TX

RELATED REPORTS & OPTIONS

Arts and Humanities
Population
Families and Households
Female Fertility
Female Fertility (Unmarried)
Race (Community Size)
Race (Percentage)
Ancestry (Community Size)
AfghanAfricanAlbanianAlsatianAmericanApacheArabArgentineanArmenianAustralianAustrianBahamianBangladeshiBarbadianBasqueBelgianBhutaneseBlackfeetBolivianBrazilianBritishBritish West IndianBulgarianBurmeseCajunCambodianCanadianCelticCentral AmericanCentral American IndianCherokeeCheyenneChickasawChileanChippewaChoctawColombianComancheCosta RicanCreekCroatianCrowCubanCzechCzechoslovakianDanishDelawareDominicanDutchDutch West IndianEastern EuropeanEcuadorianEgyptianEnglishEstonianEthiopianEuropeanFilipinoFinnishFrenchFrench American IndianFrench CanadianGermanGerman RussianGhanaianGreekGuamanian / ChamorroGuatemalanGuyaneseHaitianHonduranHopiHungarianIcelanderIndian (Asian)IndonesianInupiatIranianIraqiIrishIroquoisIsraeliItalianJamaicanJapaneseJordanianKenyanKiowaKoreanLaotianLatvianLebaneseLiberianLithuanianLuxembourgerMalaysianMalteseMexicanMexican American IndianMongolianMoroccanNative HawaiianNavajoNicaraguanNigerianNorthern EuropeanNorwegianOsageOttawaPakistaniPalestinianPanamanianPennsylvania GermanPeruvianPolishPortuguesePotawatomiPuebloPuerto RicanRomanianRussianSalvadoranSamoanScandinavianScotch-IrishScottishSerbianSiouxSlavicSlovakSloveneSomaliSouth AfricanSouth AmericanSouth American IndianSpaniardSpanishSpanish AmericanSpanish American IndianSri LankanSubsaharan AfricanSudaneseSwedishSwissSyrianThaiTonganTrinidadian and TobagonianTurkishUgandanUkrainianVenezuelanVietnameseWelshWest IndianYaquiYugoslavianZimbabwean
Ancestry (Percentage)
AfghanAfricanAlbanianAlsatianAmericanApacheArabArgentineanArmenianAustralianAustrianBahamianBangladeshiBarbadianBasqueBelgianBhutaneseBlackfeetBolivianBrazilianBritishBritish West IndianBulgarianBurmeseCajunCambodianCanadianCelticCentral AmericanCentral American IndianCherokeeCheyenneChickasawChileanChippewaChoctawColombianComancheCosta RicanCreekCroatianCrowCubanCzechCzechoslovakianDanishDelawareDominicanDutchDutch West IndianEastern EuropeanEcuadorianEgyptianEnglishEstonianEthiopianEuropeanFilipinoFinnishFrenchFrench American IndianFrench CanadianGermanGerman RussianGhanaianGreekGuamanian / ChamorroGuatemalanGuyaneseHaitianHonduranHopiHungarianIcelanderIndian (Asian)IndonesianInupiatIranianIraqiIrishIroquoisIsraeliItalianJamaicanJapaneseJordanianKenyanKiowaKoreanLaotianLatvianLebaneseLiberianLithuanianLuxembourgerMalaysianMalteseMexicanMexican American IndianMongolianMoroccanNative HawaiianNavajoNicaraguanNigerianNorthern EuropeanNorwegianOsageOttawaPakistaniPalestinianPanamanianPennsylvania GermanPeruvianPolishPortuguesePotawatomiPuebloPuerto RicanRomanianRussianSalvadoranSamoanScandinavianScotch-IrishScottishSerbianSiouxSlavicSlovakSloveneSomaliSouth AfricanSouth AmericanSouth American IndianSpaniardSpanishSpanish AmericanSpanish American IndianSri LankanSubsaharan AfricanSudaneseSwedishSwissSyrianThaiTonganTrinidadian and TobagonianTurkishUgandanUkrainianVenezuelanVietnameseWelshWest IndianYaquiYugoslavianZimbabwean
Immigrant Origin (Total)
AfghanistanAfricaAlbaniaArgentinaAsiaAustraliaBahamasBangladeshBarbadosBelarusBelizeBoliviaBosnia and HerzegovinaBrazilBulgariaBurma / MyanmarCambodiaCameroonCanadaCaribbeanCentral AmericaChileChinaColombiaCongoCosta RicaCroatiaCubaCzechoslovakiaDominican RepublicEastern AfricaEastern AsiaEastern EuropeEcuadorEgyptEl SalvadorEnglandEritreaEthiopiaEuropeFranceGermanyGhanaGreeceGuatemalaHaitiHondurasHong KongHungaryIndiaIndonesiaIranIraqIrelandIsraelItalyJamaicaJapanJordanKenyaKoreaLaosLatin AmericaLebanonLiberiaMalaysiaMexicoMicronesiaMiddle AfricaMoroccoNepalNetherlandsNicaraguaNigeriaNorthern AfricaNorthern EuropeOceaniaPakistanPanamaPeruPhilippinesPolandPortugalRomaniaRussiaScotlandSenegalSerbiaSomaliaSouth AfricaSouth AmericaSouth Central AsiaSouth Eastern AsiaSouthern EuropeSpainSri LankaSudanSwedenSwitzerlandSyriaTaiwanThailandTrinidad and TobagoTurkeyUgandaUkraineVenezuelaVietnamWestern AfricaWestern AsiaWestern EuropeZaireZimbabwe
Immigrant Origin (Percentage)
AfghanistanAfricaAlbaniaArgentinaAsiaAustraliaBahamasBangladeshBarbadosBelarusBelizeBoliviaBosnia and HerzegovinaBrazilBulgariaBurma / MyanmarCambodiaCameroonCanadaCaribbeanCentral AmericaChileChinaColombiaCongoCosta RicaCroatiaCubaCzechoslovakiaDominican RepublicEastern AfricaEastern AsiaEastern EuropeEcuadorEgyptEl SalvadorEnglandEritreaEthiopiaEuropeFranceGermanyGhanaGreeceGuatemalaHaitiHondurasHong KongHungaryIndiaIndonesiaIranIraqIrelandIsraelItalyJamaicaJapanJordanKenyaKoreaLaosLatin AmericaLebanonLiberiaMalaysiaMexicoMicronesiaMiddle AfricaMoroccoNepalNetherlandsNicaraguaNigeriaNorthern AfricaNorthern EuropeOceaniaPakistanPanamaPeruPhilippinesPolandPortugalRomaniaRussiaScotlandSenegalSerbiaSomaliaSouth AfricaSouth AmericaSouth Central AsiaSouth Eastern AsiaSouthern EuropeSpainSri LankaSudanSwedenSwitzerlandSyriaTaiwanThailandTrinidad and TobagoTurkeyUgandaUkraineVenezuelaVietnamWestern AfricaWestern AsiaWestern EuropeZaireZimbabwe
Income
Income (Families)
Income (Households)
Poverty
Poverty (Families)
Unemployment
Employment Occupations
Employment Industries
Employer Class
Commute Time
Commute Means
School Enrollment
Education by Degree Field
Occupancy
Finances
Physical Characteristics
Fort Worth
Compare Zip Codes
Comparison Subject

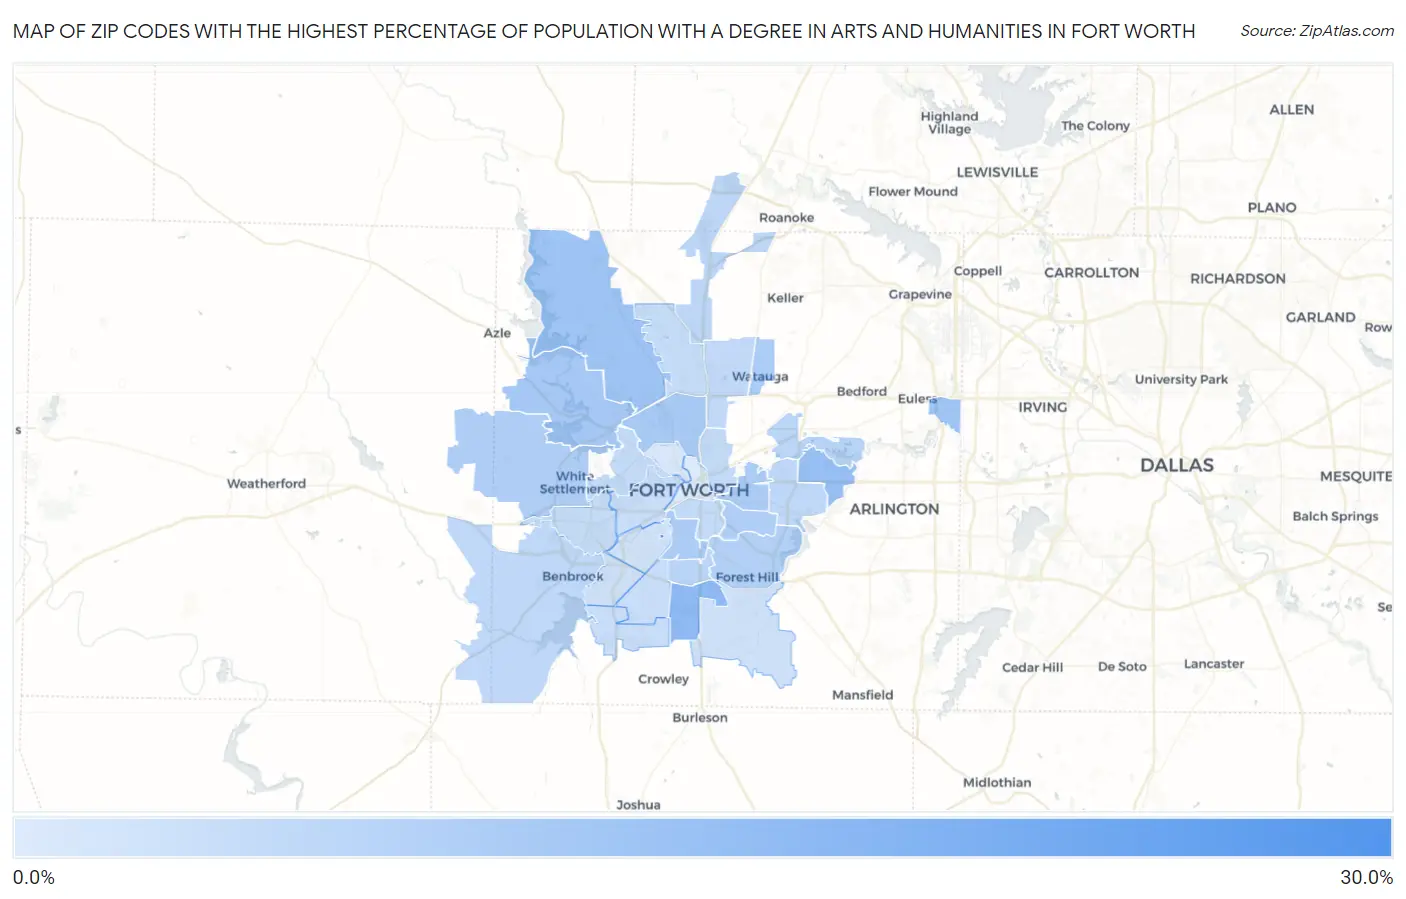
Map of Zip Codes with the Highest Percentage of Population with a Degree in Arts and Humanities in Fort Worth

0.0%
30.0%
Zip Codes with the Highest Percentage of Population with a Degree in Arts and Humanities in Fort Worth Map

Zip Codes with the Highest Percentage of Population with a Degree in Arts and Humanities in Fort Worth, TX

Zip Code % Graduates vs State vs National
1.7612926.3%6.3%(+20.0)#496.0%(+20.3)#867
2.7613414.2%6.3%(+7.89)#1876.0%(+8.20)#3,028
3.7612012.7%6.3%(+6.36)#2376.0%(+6.68)#3,850
4.7617911.6%6.3%(+5.30)#2946.0%(+5.62)#4,598
5.7615511.1%6.3%(+4.83)#3306.0%(+5.14)#4,990
6.7613510.3%6.3%(+3.97)#3916.0%(+4.28)#5,892
7.7610610.0%6.3%(+3.73)#4116.0%(+4.04)#6,183
8.761489.2%6.3%(+2.85)#4896.0%(+3.17)#7,461
9.761109.2%6.3%(+2.84)#4916.0%(+3.16)#7,477
10.761039.1%6.3%(+2.82)#4946.0%(+3.14)#7,515
11.761088.9%6.3%(+2.54)#5246.0%(+2.86)#7,981
12.761058.6%6.3%(+2.31)#5596.0%(+2.63)#8,390
13.761198.1%6.3%(+1.78)#6276.0%(+2.09)#9,474
14.761187.3%6.3%(+0.975)#7406.0%(+1.29)#11,248
15.761157.1%6.3%(+0.834)#7536.0%(+1.15)#11,572
16.761776.7%6.3%(+0.360)#8306.0%(+0.677)#12,807
17.761126.6%6.3%(+0.270)#8466.0%(+0.587)#13,043
18.761266.5%6.3%(+0.227)#8536.0%(+0.544)#13,149
19.761376.2%6.3%(-0.151)#9116.0%(+0.166)#14,213
20.761045.8%6.3%(-0.558)#9736.0%(-0.241)#15,362
21.761115.7%6.3%(-0.598)#9786.0%(-0.281)#15,481
22.761145.7%6.3%(-0.612)#9816.0%(-0.295)#15,538
23.761315.6%6.3%(-0.730)#9966.0%(-0.413)#15,897
24.761165.6%6.3%(-0.740)#9976.0%(-0.423)#15,919
25.761235.2%6.3%(-1.06)#1,0546.0%(-0.747)#16,884
26.761075.1%6.3%(-1.23)#1,0826.0%(-0.916)#17,361
27.761335.0%6.3%(-1.29)#1,0926.0%(-0.975)#17,518
28.761324.0%6.3%(-2.32)#1,2496.0%(-2.00)#20,372
29.761404.0%6.3%(-2.33)#1,2546.0%(-2.01)#20,391
30.761093.7%6.3%(-2.65)#1,2856.0%(-2.34)#21,192
31.761642.6%6.3%(-3.71)#1,4096.0%(-3.39)#23,383
32.761022.0%6.3%(-4.30)#1,4576.0%(-3.98)#24,312

Common Questions

What are the Top 10 Zip Codes with the Highest Percentage of Population with a Degree in Arts and Humanities in Fort Worth, TX?
Top 10 Zip Codes with the Highest Percentage of Population with a Degree in Arts and Humanities in Fort Worth, TX are:
#1
26.3%
#2
14.2%
#3
12.7%
#4
11.6%
#5
11.1%
#6
10.3%
#7
10.0%
#8
9.2%
#9
9.2%
#10
9.1%
What zip code has the Highest Percentage of Population with a Degree in Arts and Humanities in Fort Worth, TX?
76129 has the Highest Percentage of Population with a Degree in Arts and Humanities in Fort Worth, TX with 26.3%.
What is the Percentage of Population with a Degree in Arts and Humanities in Fort Worth, TX?
Percentage of Population with a Degree in Arts and Humanities in Fort Worth is 6.9%.
What is the Percentage of Population with a Degree in Arts and Humanities in Texas?
Percentage of Population with a Degree in Arts and Humanities in Texas is 6.3%.
What is the Percentage of Population with a Degree in Arts and Humanities in the United States?
Percentage of Population with a Degree in Arts and Humanities in the United States is 6.0%.