Zip Codes with the Highest Percentage of Population Employed in Education Instruction & Library in Fort Worth, TX
RELATED REPORTS & OPTIONS
Education Instruction & Library
Fort Worth
Compare Zip Codes
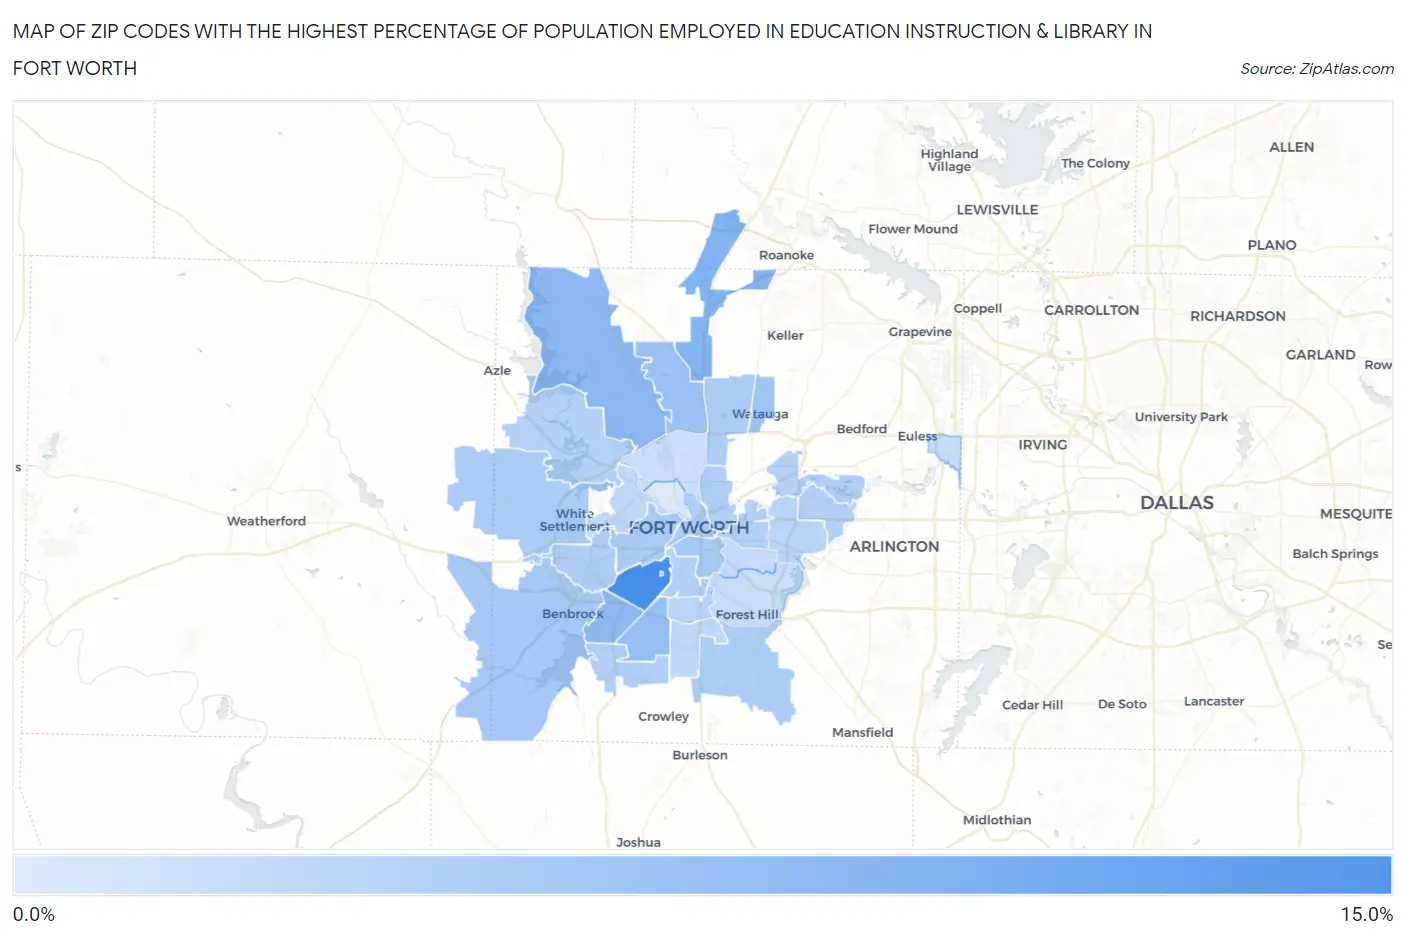
Map of Zip Codes with the Highest Percentage of Population Employed in Education Instruction & Library in Fort Worth
1.5%
14.1%
Zip Codes with the Highest Percentage of Population Employed in Education Instruction & Library in Fort Worth, TX
| Zip Code | % Employed | vs State | vs National | |
| 1. | 76109 | 14.1% | 6.4%(+7.78)#97 | 6.2%(+7.96)#1,501 |
| 2. | 76129 | 9.9% | 6.4%(+3.50)#268 | 6.2%(+3.68)#4,096 |
| 3. | 76177 | 9.0% | 6.4%(+2.63)#356 | 6.2%(+2.82)#5,235 |
| 4. | 76179 | 8.1% | 6.4%(+1.71)#470 | 6.2%(+1.89)#6,987 |
| 5. | 76132 | 7.9% | 6.4%(+1.56)#489 | 6.2%(+1.74)#7,323 |
| 6. | 76133 | 7.4% | 6.4%(+0.994)#587 | 6.2%(+1.18)#8,832 |
| 7. | 76131 | 7.0% | 6.4%(+0.598)#671 | 6.2%(+0.780)#10,039 |
| 8. | 76148 | 6.5% | 6.4%(+0.166)#759 | 6.2%(+0.348)#11,510 |
| 9. | 76126 | 6.0% | 6.4%(-0.363)#881 | 6.2%(-0.181)#13,488 |
| 10. | 76104 | 5.8% | 6.4%(-0.518)#919 | 6.2%(-0.335)#14,114 |
| 11. | 76108 | 5.7% | 6.4%(-0.693)#962 | 6.2%(-0.511)#14,863 |
| 12. | 76107 | 5.6% | 6.4%(-0.812)#986 | 6.2%(-0.629)#15,338 |
| 13. | 76137 | 5.4% | 6.4%(-0.950)#1,021 | 6.2%(-0.767)#15,920 |
| 14. | 76140 | 5.4% | 6.4%(-1.01)#1,044 | 6.2%(-0.827)#16,167 |
| 15. | 76102 | 5.2% | 6.4%(-1.17)#1,087 | 6.2%(-0.989)#16,799 |
| 16. | 76116 | 5.1% | 6.4%(-1.26)#1,108 | 6.2%(-1.08)#17,199 |
| 17. | 76111 | 5.1% | 6.4%(-1.31)#1,117 | 6.2%(-1.13)#17,405 |
| 18. | 76123 | 5.0% | 6.4%(-1.36)#1,126 | 6.2%(-1.17)#17,609 |
| 19. | 76103 | 4.9% | 6.4%(-1.50)#1,154 | 6.2%(-1.32)#18,213 |
| 20. | 76120 | 4.9% | 6.4%(-1.51)#1,158 | 6.2%(-1.33)#18,253 |
| 21. | 76118 | 4.8% | 6.4%(-1.55)#1,166 | 6.2%(-1.37)#18,448 |
| 22. | 76135 | 4.8% | 6.4%(-1.58)#1,172 | 6.2%(-1.39)#18,537 |
| 23. | 76110 | 4.8% | 6.4%(-1.60)#1,176 | 6.2%(-1.42)#18,638 |
| 24. | 76112 | 4.3% | 6.4%(-2.03)#1,268 | 6.2%(-1.85)#20,378 |
| 25. | 76115 | 4.3% | 6.4%(-2.07)#1,279 | 6.2%(-1.88)#20,509 |
| 26. | 76114 | 3.9% | 6.4%(-2.46)#1,367 | 6.2%(-2.28)#22,011 |
| 27. | 76134 | 3.9% | 6.4%(-2.50)#1,375 | 6.2%(-2.32)#22,159 |
| 28. | 76155 | 3.4% | 6.4%(-2.95)#1,457 | 6.2%(-2.77)#23,623 |
| 29. | 76105 | 3.3% | 6.4%(-3.11)#1,490 | 6.2%(-2.93)#24,174 |
| 30. | 76119 | 3.1% | 6.4%(-3.26)#1,507 | 6.2%(-3.08)#24,599 |
| 31. | 76106 | 2.9% | 6.4%(-3.47)#1,525 | 6.2%(-3.29)#25,070 |
| 32. | 76164 | 1.5% | 6.4%(-4.88)#1,655 | 6.2%(-4.70)#27,691 |
1
Common Questions
What are the Top 10 Zip Codes with the Highest Percentage of Population Employed in Education Instruction & Library in Fort Worth, TX?
Top 10 Zip Codes with the Highest Percentage of Population Employed in Education Instruction & Library in Fort Worth, TX are:
What zip code has the Highest Percentage of Population Employed in Education Instruction & Library in Fort Worth, TX?
76109 has the Highest Percentage of Population Employed in Education Instruction & Library in Fort Worth, TX with 14.1%.
What is the Percentage of Population Employed in Education Instruction & Library in Fort Worth, TX?
Percentage of Population Employed in Education Instruction & Library in Fort Worth is 5.9%.
What is the Percentage of Population Employed in Education Instruction & Library in Texas?
Percentage of Population Employed in Education Instruction & Library in Texas is 6.4%.
What is the Percentage of Population Employed in Education Instruction & Library in the United States?
Percentage of Population Employed in Education Instruction & Library in the United States is 6.2%.