Zip Codes with the Highest Percentage of Population with a Degree in Literature and Languages in Fort Worth, TX

RELATED REPORTS & OPTIONS

Literature and Languages
Population
Families and Households
Female Fertility
Female Fertility (Unmarried)
Race (Community Size)
Race (Percentage)
Ancestry (Community Size)
AfghanAfricanAlbanianAlsatianAmericanApacheArabArgentineanArmenianAustralianAustrianBahamianBangladeshiBarbadianBasqueBelgianBhutaneseBlackfeetBolivianBrazilianBritishBritish West IndianBulgarianBurmeseCajunCambodianCanadianCelticCentral AmericanCentral American IndianCherokeeCheyenneChickasawChileanChippewaChoctawColombianComancheCosta RicanCreekCroatianCrowCubanCzechCzechoslovakianDanishDelawareDominicanDutchDutch West IndianEastern EuropeanEcuadorianEgyptianEnglishEstonianEthiopianEuropeanFilipinoFinnishFrenchFrench American IndianFrench CanadianGermanGerman RussianGhanaianGreekGuamanian / ChamorroGuatemalanGuyaneseHaitianHonduranHopiHungarianIcelanderIndian (Asian)IndonesianInupiatIranianIraqiIrishIroquoisIsraeliItalianJamaicanJapaneseJordanianKenyanKiowaKoreanLaotianLatvianLebaneseLiberianLithuanianLuxembourgerMalaysianMalteseMexicanMexican American IndianMongolianMoroccanNative HawaiianNavajoNicaraguanNigerianNorthern EuropeanNorwegianOsageOttawaPakistaniPalestinianPanamanianPennsylvania GermanPeruvianPolishPortuguesePotawatomiPuebloPuerto RicanRomanianRussianSalvadoranSamoanScandinavianScotch-IrishScottishSerbianSiouxSlavicSlovakSloveneSomaliSouth AfricanSouth AmericanSouth American IndianSpaniardSpanishSpanish AmericanSpanish American IndianSri LankanSubsaharan AfricanSudaneseSwedishSwissSyrianThaiTonganTrinidadian and TobagonianTurkishUgandanUkrainianVenezuelanVietnameseWelshWest IndianYaquiYugoslavianZimbabwean
Ancestry (Percentage)
AfghanAfricanAlbanianAlsatianAmericanApacheArabArgentineanArmenianAustralianAustrianBahamianBangladeshiBarbadianBasqueBelgianBhutaneseBlackfeetBolivianBrazilianBritishBritish West IndianBulgarianBurmeseCajunCambodianCanadianCelticCentral AmericanCentral American IndianCherokeeCheyenneChickasawChileanChippewaChoctawColombianComancheCosta RicanCreekCroatianCrowCubanCzechCzechoslovakianDanishDelawareDominicanDutchDutch West IndianEastern EuropeanEcuadorianEgyptianEnglishEstonianEthiopianEuropeanFilipinoFinnishFrenchFrench American IndianFrench CanadianGermanGerman RussianGhanaianGreekGuamanian / ChamorroGuatemalanGuyaneseHaitianHonduranHopiHungarianIcelanderIndian (Asian)IndonesianInupiatIranianIraqiIrishIroquoisIsraeliItalianJamaicanJapaneseJordanianKenyanKiowaKoreanLaotianLatvianLebaneseLiberianLithuanianLuxembourgerMalaysianMalteseMexicanMexican American IndianMongolianMoroccanNative HawaiianNavajoNicaraguanNigerianNorthern EuropeanNorwegianOsageOttawaPakistaniPalestinianPanamanianPennsylvania GermanPeruvianPolishPortuguesePotawatomiPuebloPuerto RicanRomanianRussianSalvadoranSamoanScandinavianScotch-IrishScottishSerbianSiouxSlavicSlovakSloveneSomaliSouth AfricanSouth AmericanSouth American IndianSpaniardSpanishSpanish AmericanSpanish American IndianSri LankanSubsaharan AfricanSudaneseSwedishSwissSyrianThaiTonganTrinidadian and TobagonianTurkishUgandanUkrainianVenezuelanVietnameseWelshWest IndianYaquiYugoslavianZimbabwean
Immigrant Origin (Total)
AfghanistanAfricaAlbaniaArgentinaAsiaAustraliaBahamasBangladeshBarbadosBelarusBelizeBoliviaBosnia and HerzegovinaBrazilBulgariaBurma / MyanmarCambodiaCameroonCanadaCaribbeanCentral AmericaChileChinaColombiaCongoCosta RicaCroatiaCubaCzechoslovakiaDominican RepublicEastern AfricaEastern AsiaEastern EuropeEcuadorEgyptEl SalvadorEnglandEritreaEthiopiaEuropeFranceGermanyGhanaGreeceGuatemalaHaitiHondurasHong KongHungaryIndiaIndonesiaIranIraqIrelandIsraelItalyJamaicaJapanJordanKenyaKoreaLaosLatin AmericaLebanonLiberiaMalaysiaMexicoMicronesiaMiddle AfricaMoroccoNepalNetherlandsNicaraguaNigeriaNorthern AfricaNorthern EuropeOceaniaPakistanPanamaPeruPhilippinesPolandPortugalRomaniaRussiaScotlandSenegalSerbiaSomaliaSouth AfricaSouth AmericaSouth Central AsiaSouth Eastern AsiaSouthern EuropeSpainSri LankaSudanSwedenSwitzerlandSyriaTaiwanThailandTrinidad and TobagoTurkeyUgandaUkraineVenezuelaVietnamWestern AfricaWestern AsiaWestern EuropeZaireZimbabwe
Immigrant Origin (Percentage)
AfghanistanAfricaAlbaniaArgentinaAsiaAustraliaBahamasBangladeshBarbadosBelarusBelizeBoliviaBosnia and HerzegovinaBrazilBulgariaBurma / MyanmarCambodiaCameroonCanadaCaribbeanCentral AmericaChileChinaColombiaCongoCosta RicaCroatiaCubaCzechoslovakiaDominican RepublicEastern AfricaEastern AsiaEastern EuropeEcuadorEgyptEl SalvadorEnglandEritreaEthiopiaEuropeFranceGermanyGhanaGreeceGuatemalaHaitiHondurasHong KongHungaryIndiaIndonesiaIranIraqIrelandIsraelItalyJamaicaJapanJordanKenyaKoreaLaosLatin AmericaLebanonLiberiaMalaysiaMexicoMicronesiaMiddle AfricaMoroccoNepalNetherlandsNicaraguaNigeriaNorthern AfricaNorthern EuropeOceaniaPakistanPanamaPeruPhilippinesPolandPortugalRomaniaRussiaScotlandSenegalSerbiaSomaliaSouth AfricaSouth AmericaSouth Central AsiaSouth Eastern AsiaSouthern EuropeSpainSri LankaSudanSwedenSwitzerlandSyriaTaiwanThailandTrinidad and TobagoTurkeyUgandaUkraineVenezuelaVietnamWestern AfricaWestern AsiaWestern EuropeZaireZimbabwe
Income
Income (Families)
Income (Households)
Poverty
Poverty (Families)
Unemployment
Employment Occupations
Employment Industries
Employer Class
Commute Time
Commute Means
School Enrollment
Education by Degree Field
Occupancy
Finances
Physical Characteristics
Fort Worth
Compare Zip Codes
Comparison Subject

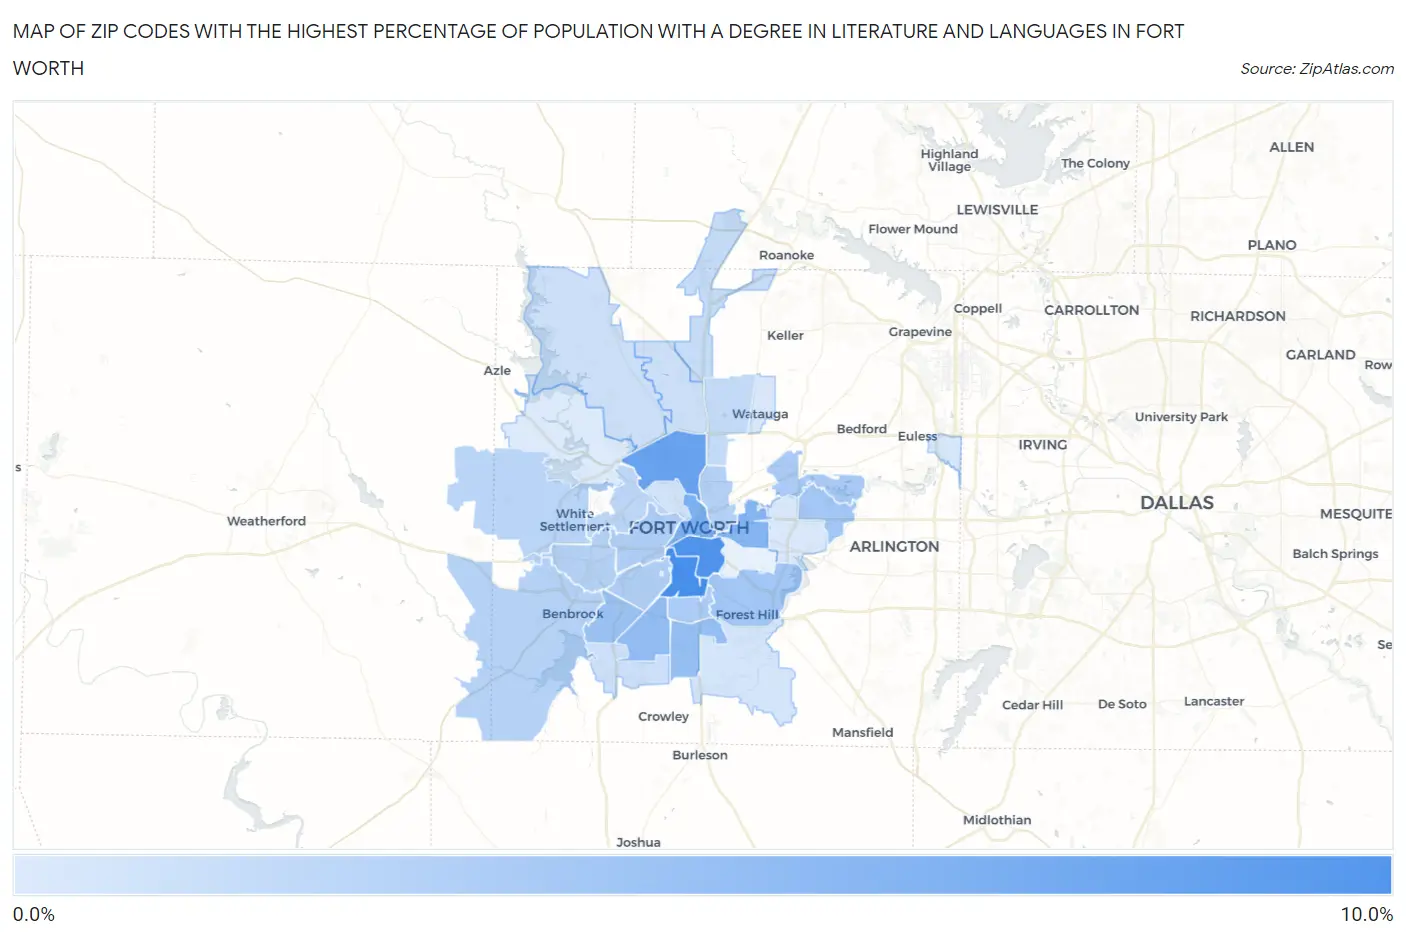
Map of Zip Codes with the Highest Percentage of Population with a Degree in Literature and Languages in Fort Worth

0.0%
10.0%
Zip Codes with the Highest Percentage of Population with a Degree in Literature and Languages in Fort Worth Map

Zip Codes with the Highest Percentage of Population with a Degree in Literature and Languages in Fort Worth, TX

Zip Code % Graduates vs State vs National
1.761108.2%3.4%(+4.76)#1284.4%(+3.79)#2,823
2.761047.8%3.4%(+4.38)#1344.4%(+3.41)#3,143
3.761066.7%3.4%(+3.26)#1804.4%(+2.28)#4,374
4.761025.7%3.4%(+2.31)#2424.4%(+1.34)#5,846
5.761035.3%3.4%(+1.87)#2764.4%(+0.902)#6,699
6.761334.7%3.4%(+1.28)#3424.4%(+0.305)#8,132
7.761344.6%3.4%(+1.12)#3634.4%(+0.148)#8,551
8.761324.4%3.4%(+0.915)#4004.4%(-0.058)#9,141
9.761204.0%3.4%(+0.561)#4524.4%(-0.411)#10,184
10.761194.0%3.4%(+0.549)#4554.4%(-0.424)#10,209
11.761183.7%3.4%(+0.248)#5234.4%(-0.724)#11,215
12.761153.5%3.4%(+0.112)#5554.4%(-0.860)#11,681
13.761073.5%3.4%(+0.054)#5774.4%(-0.919)#11,881
14.761093.3%3.4%(-0.111)#6154.4%(-1.08)#12,444
15.761113.2%3.4%(-0.216)#6474.4%(-1.19)#12,834
16.761263.2%3.4%(-0.277)#6644.4%(-1.25)#13,033
17.761163.1%3.4%(-0.334)#6754.4%(-1.31)#13,207
18.761082.9%3.4%(-0.540)#7204.4%(-1.51)#13,913
19.761142.9%3.4%(-0.569)#7274.4%(-1.54)#14,008
20.761372.5%3.4%(-0.959)#8384.4%(-1.93)#15,382
21.761772.5%3.4%(-0.976)#8444.4%(-1.95)#15,463
22.761792.1%3.4%(-1.30)#9344.4%(-2.27)#16,618
23.761232.1%3.4%(-1.30)#9364.4%(-2.28)#16,626
24.761312.1%3.4%(-1.34)#9464.4%(-2.32)#16,752
25.761642.0%3.4%(-1.48)#9774.4%(-2.46)#17,245
26.761401.8%3.4%(-1.61)#1,0024.4%(-2.58)#17,608
27.761551.7%3.4%(-1.71)#1,0274.4%(-2.69)#17,939
28.761481.6%3.4%(-1.85)#1,0624.4%(-2.82)#18,383
29.761121.5%3.4%(-1.89)#1,0734.4%(-2.87)#18,518
30.761351.4%3.4%(-2.03)#1,1104.4%(-3.00)#18,984

Common Questions

What are the Top 10 Zip Codes with the Highest Percentage of Population with a Degree in Literature and Languages in Fort Worth, TX?
Top 10 Zip Codes with the Highest Percentage of Population with a Degree in Literature and Languages in Fort Worth, TX are:
#1
8.2%
#2
7.8%
#3
6.7%
#4
5.7%
#5
5.3%
#6
4.7%
#7
4.6%
#8
4.4%
#9
4.0%
#10
4.0%
What zip code has the Highest Percentage of Population with a Degree in Literature and Languages in Fort Worth, TX?
76110 has the Highest Percentage of Population with a Degree in Literature and Languages in Fort Worth, TX with 8.2%.
What is the Percentage of Population with a Degree in Literature and Languages in Fort Worth, TX?
Percentage of Population with a Degree in Literature and Languages in Fort Worth is 3.1%.
What is the Percentage of Population with a Degree in Literature and Languages in Texas?
Percentage of Population with a Degree in Literature and Languages in Texas is 3.4%.
What is the Percentage of Population with a Degree in Literature and Languages in the United States?
Percentage of Population with a Degree in Literature and Languages in the United States is 4.4%.