Zip Codes with the Highest Percentage of Population Employed in Real Estate, Rental & Leasing in Fort Worth, TX
RELATED REPORTS & OPTIONS
Real Estate, Rental & Leasing
Fort Worth
Compare Zip Codes
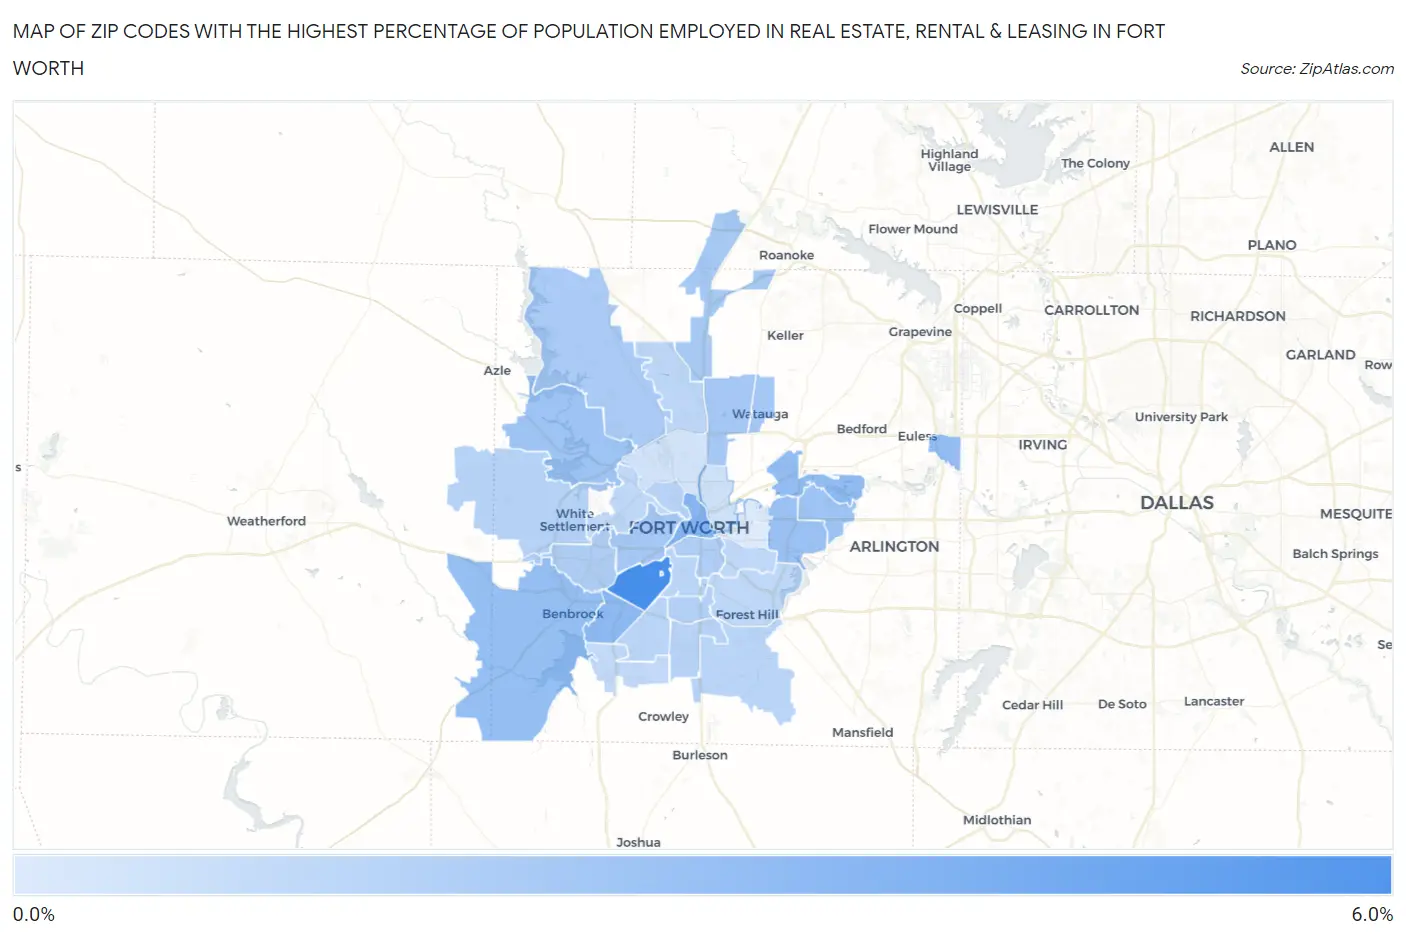
Map of Zip Codes with the Highest Percentage of Population Employed in Real Estate, Rental & Leasing in Fort Worth
0.18%
5.7%
Zip Codes with the Highest Percentage of Population Employed in Real Estate, Rental & Leasing in Fort Worth, TX
| Zip Code | % Employed | vs State | vs National | |
| 1. | 76109 | 5.7% | 2.0%(+3.68)#56 | 1.9%(+3.79)#1,081 |
| 2. | 76102 | 3.4% | 2.0%(+1.36)#194 | 1.9%(+1.48)#3,087 |
| 3. | 76132 | 3.0% | 2.0%(+0.995)#258 | 1.9%(+1.11)#3,896 |
| 4. | 76118 | 2.9% | 2.0%(+0.879)#291 | 1.9%(+0.995)#4,205 |
| 5. | 76155 | 2.8% | 2.0%(+0.824)#302 | 1.9%(+0.940)#4,349 |
| 6. | 76126 | 2.8% | 2.0%(+0.782)#312 | 1.9%(+0.898)#4,460 |
| 7. | 76112 | 2.6% | 2.0%(+0.608)#349 | 1.9%(+0.724)#5,049 |
| 8. | 76135 | 2.4% | 2.0%(+0.440)#412 | 1.9%(+0.556)#5,688 |
| 9. | 76120 | 2.4% | 2.0%(+0.421)#424 | 1.9%(+0.537)#5,767 |
| 10. | 76137 | 2.2% | 2.0%(+0.202)#490 | 1.9%(+0.318)#6,760 |
| 11. | 76107 | 2.2% | 2.0%(+0.180)#497 | 1.9%(+0.296)#6,866 |
| 12. | 76148 | 2.2% | 2.0%(+0.164)#505 | 1.9%(+0.280)#6,947 |
| 13. | 76177 | 2.1% | 2.0%(+0.074)#542 | 1.9%(+0.190)#7,415 |
| 14. | 76179 | 2.0% | 2.0%(-0.025)#574 | 1.9%(+0.091)#7,934 |
| 15. | 76129 | 1.9% | 2.0%(-0.141)#625 | 1.9%(-0.025)#8,673 |
| 16. | 76116 | 1.8% | 2.0%(-0.158)#633 | 1.9%(-0.042)#8,789 |
| 17. | 76104 | 1.8% | 2.0%(-0.196)#647 | 1.9%(-0.080)#9,045 |
| 18. | 76115 | 1.7% | 2.0%(-0.302)#699 | 1.9%(-0.186)#9,715 |
| 19. | 76108 | 1.6% | 2.0%(-0.393)#739 | 1.9%(-0.277)#10,352 |
| 20. | 76164 | 1.5% | 2.0%(-0.473)#790 | 1.9%(-0.357)#10,898 |
| 21. | 76134 | 1.5% | 2.0%(-0.517)#812 | 1.9%(-0.401)#11,228 |
| 22. | 76140 | 1.5% | 2.0%(-0.555)#830 | 1.9%(-0.439)#11,552 |
| 23. | 76110 | 1.4% | 2.0%(-0.559)#833 | 1.9%(-0.443)#11,593 |
| 24. | 76133 | 1.4% | 2.0%(-0.583)#846 | 1.9%(-0.467)#11,791 |
| 25. | 76131 | 1.4% | 2.0%(-0.656)#882 | 1.9%(-0.540)#12,330 |
| 26. | 76119 | 1.3% | 2.0%(-0.737)#919 | 1.9%(-0.621)#12,950 |
| 27. | 76105 | 1.3% | 2.0%(-0.740)#922 | 1.9%(-0.624)#12,973 |
| 28. | 76114 | 1.2% | 2.0%(-0.768)#937 | 1.9%(-0.652)#13,166 |
| 29. | 76123 | 1.2% | 2.0%(-0.824)#960 | 1.9%(-0.708)#13,613 |
| 30. | 76111 | 0.71% | 2.0%(-1.29)#1,150 | 1.9%(-1.18)#17,368 |
| 31. | 76106 | 0.60% | 2.0%(-1.41)#1,190 | 1.9%(-1.29)#18,272 |
| 32. | 76103 | 0.18% | 2.0%(-1.82)#1,321 | 1.9%(-1.71)#21,096 |
1
Common Questions
What are the Top 10 Zip Codes with the Highest Percentage of Population Employed in Real Estate, Rental & Leasing in Fort Worth, TX?
Top 10 Zip Codes with the Highest Percentage of Population Employed in Real Estate, Rental & Leasing in Fort Worth, TX are:
What zip code has the Highest Percentage of Population Employed in Real Estate, Rental & Leasing in Fort Worth, TX?
76109 has the Highest Percentage of Population Employed in Real Estate, Rental & Leasing in Fort Worth, TX with 5.7%.
What is the Percentage of Population Employed in Real Estate, Rental & Leasing in Fort Worth, TX?
Percentage of Population Employed in Real Estate, Rental & Leasing in Fort Worth is 1.9%.
What is the Percentage of Population Employed in Real Estate, Rental & Leasing in Texas?
Percentage of Population Employed in Real Estate, Rental & Leasing in Texas is 2.0%.
What is the Percentage of Population Employed in Real Estate, Rental & Leasing in the United States?
Percentage of Population Employed in Real Estate, Rental & Leasing in the United States is 1.9%.